

Will Polkadot [DOT] be subjected to sharp sell-off coming week
Disclaimer: The findings of the following analysis are the sole opinions of the writer and should not be considered investment advice.
Bitcoin [BTC] fell by nearly 7% in recent hours of trading and had a bearish short-term outlook yet again. Many altcoins also followed and posted double-digit percentage losses over the previous day of trading alone.
Polkadot [DOT] was one of these coins. The coin was able to climb to the $7.7 mark on the back of steady demand. However, the buyers quickly turned into sellers as fear gripped the market yet again.
DOT- 1-Hour Chart
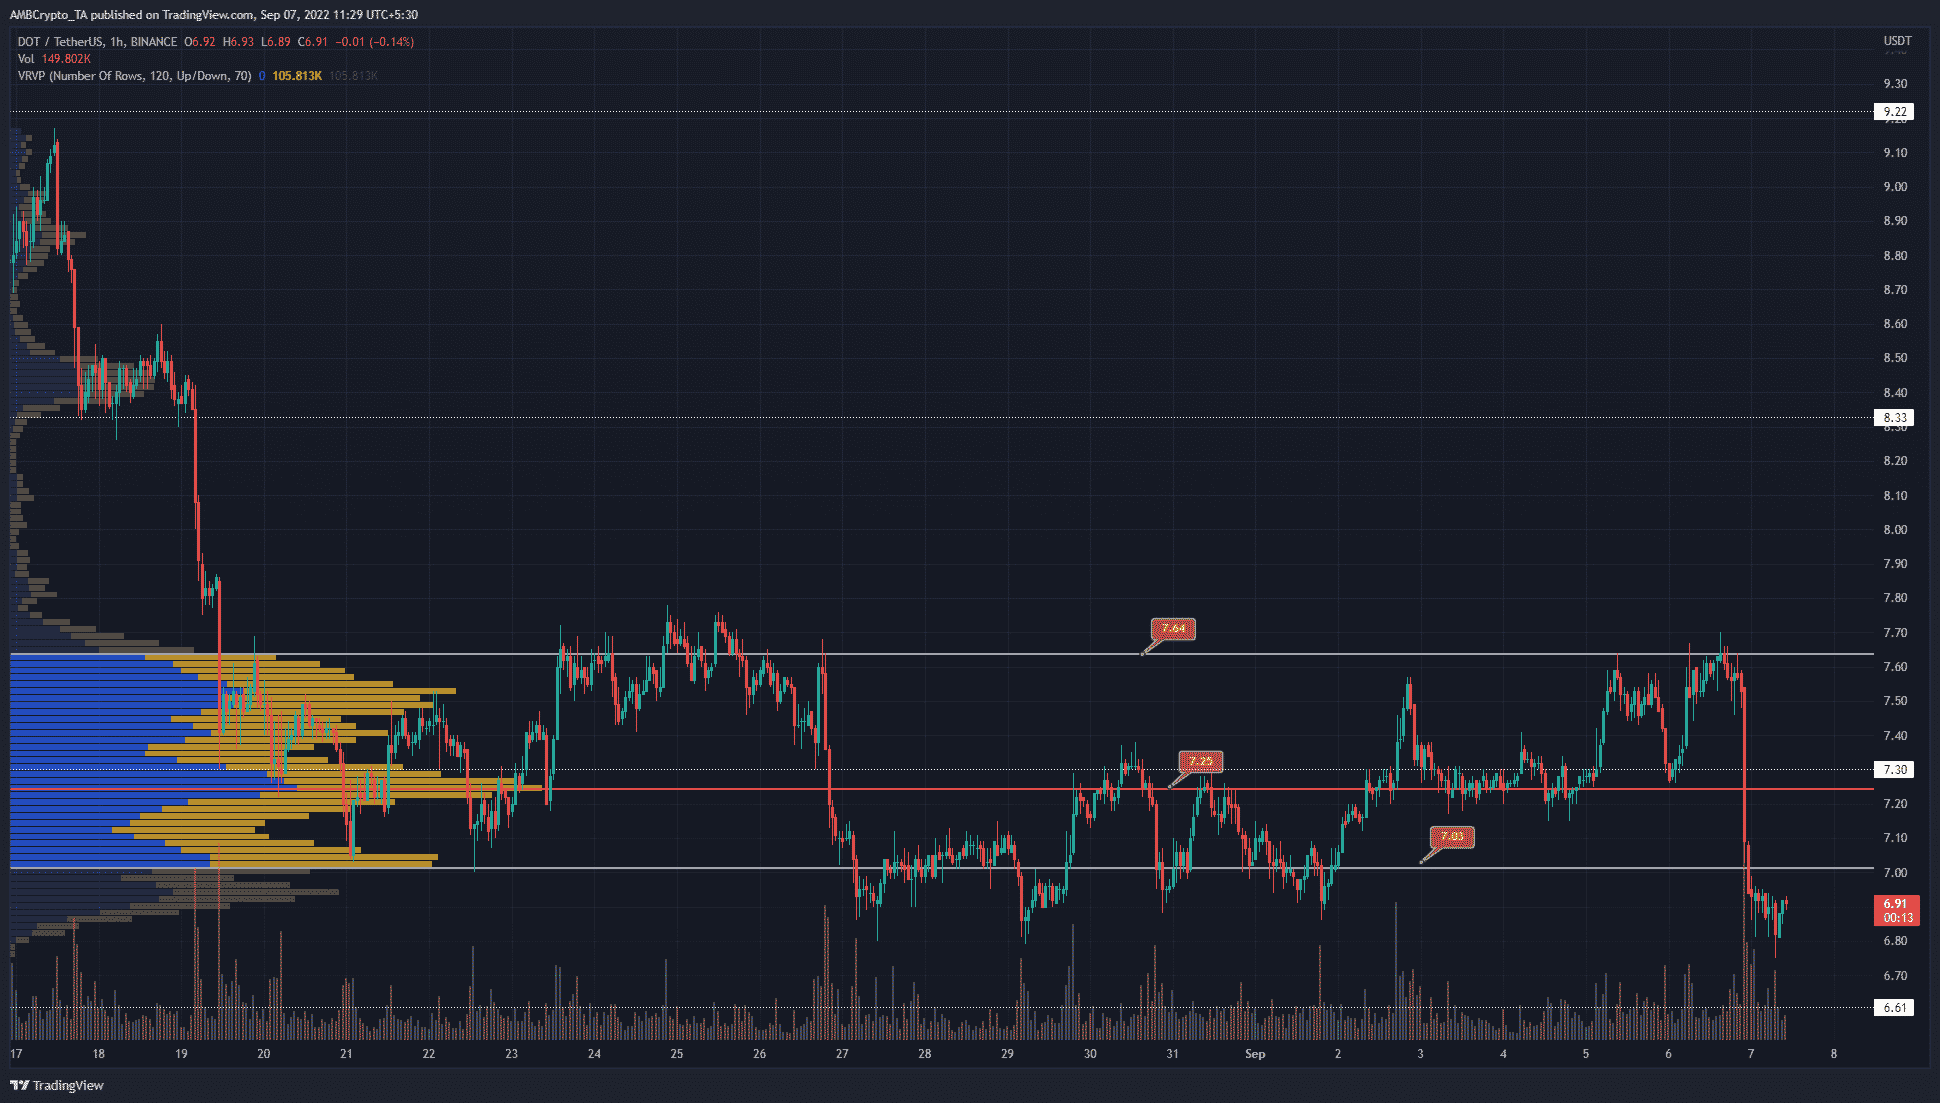
Source: DOT/USDT on TradingView
Polkadot has traded within the $7.7 and $6.9 area for most of the past two weeks. The Volumpe Profile Visible Range tool showed the Point of Control to lie at $7.25. This was the point at which the most trading volume was witnessed over the visible range. It marked a significant level of support, one that DOT smashed past the previous day.
The Value Area Low (VAL) and High lay at $7.03 and $7.64. At the time of writing, the price was beneath the VAL. The VAL represented a decent buying opportunity, but the dip beneath $7 meant that long positions might be unsafe.
A revisit to the $7 and $7.3 could occur as the price searches for liquidity. However, the $7.25-$7.3 belt would likely pose far too much resistance for DOT to be able to break past on its first couple of tries.
Rationale
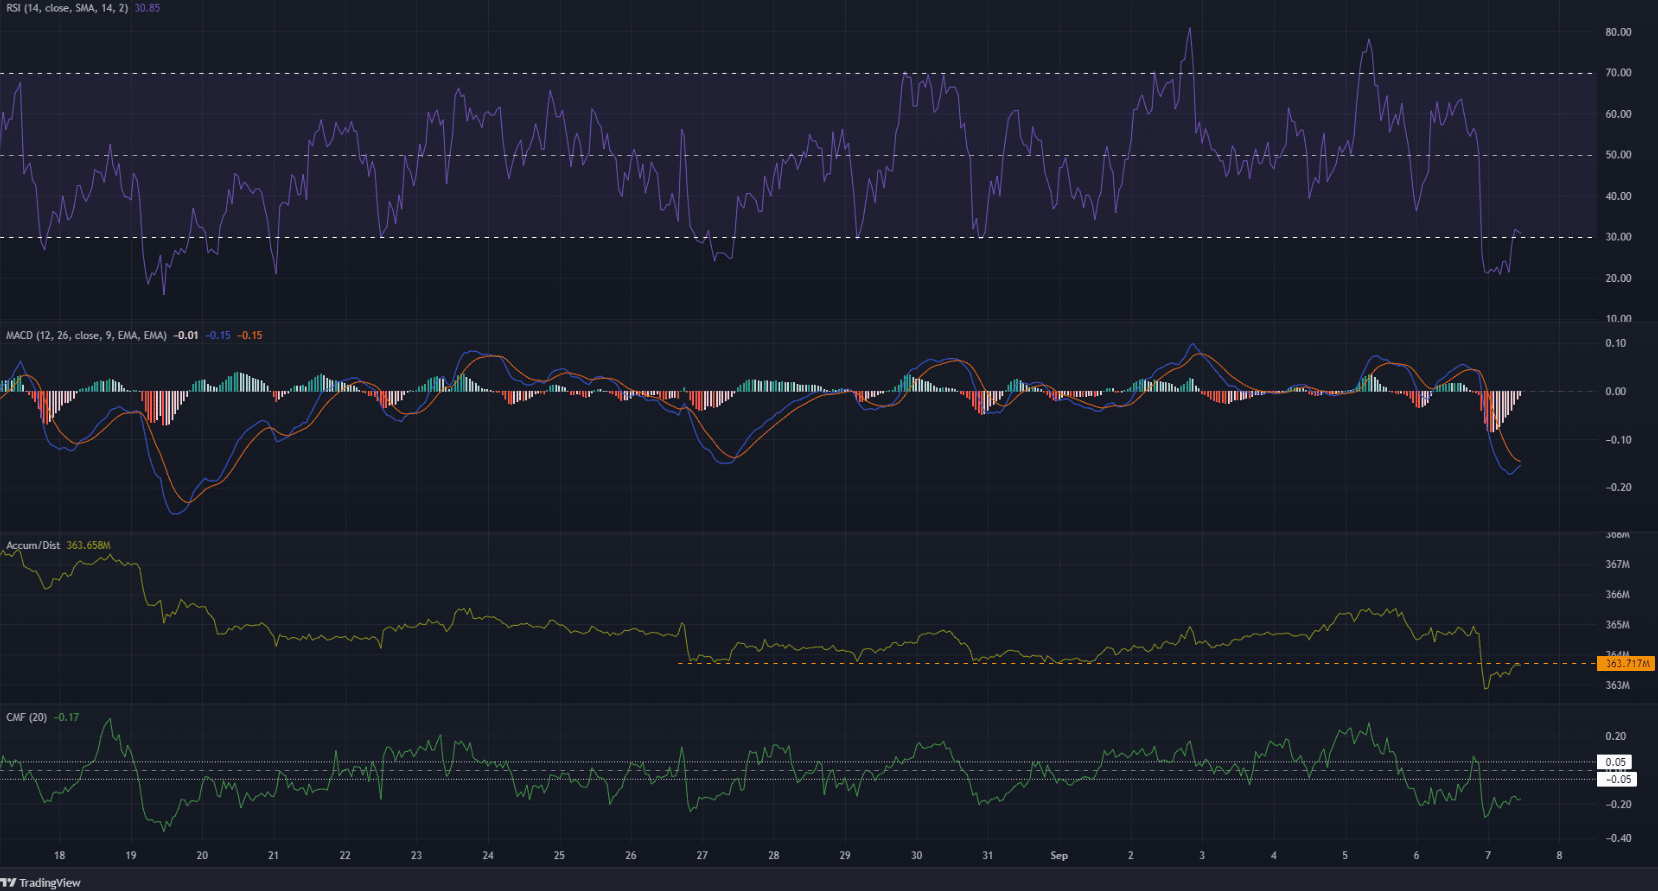
Source: DOT/USDT on TradingView
The Relative Strength Index (RSI) dropped from 60 to 22 over the course of the previous day’s trading. The Moving Average Convergence Divergence (MACD) also saw a sharp plunge beneath the zero line.
It was pretty straightforward that bearish momentum was dominant in recent hours. But can a relief rally be expected for DOT?
The Accumulation/Distribution (A/D) indicator saw a drop as well and was below a resistance level from last week. A rejection at this level could be a precursor to further losses. The Chaikin Money Flow (CMF) also hinted at a bearish bias. It was firmly below the -0.05 mark to indicate significant selling pressure.
Conclusion
The price would need to flip $7.3 to support before a bullish short-term bias can be justified. The volume indicators would also need to climb past their respective resistance levels. It appeared more likely that a move to $7.25-$7.3 would offer a selling opportunity than a buying one.
Leave a Reply