

Will MATIC Price Lose $0.75 Support Amid Market Correction?

Published 1 hour ago
The MATIC/USDT pair resonated in a rising wedge pattern from late July to mid-August. This bearish pattern after a long recovery rally suggested the losing bullish momentum. Furthermore, on August 15th, the coin price reverted from the confluence resistance of $1, 200-day EMA and resistance trendline and triggered a bear cycle within the wedge pattern,
Key points MATIC analysis:
- The MATIC price has depreciated 26% since last week.
- The correction phase has plunged the MATIC price to 0.382 Fibonacci retracement levels
- The intraday trading volume in the MATIC is $553.2 Million, indicating a 20.2% loss
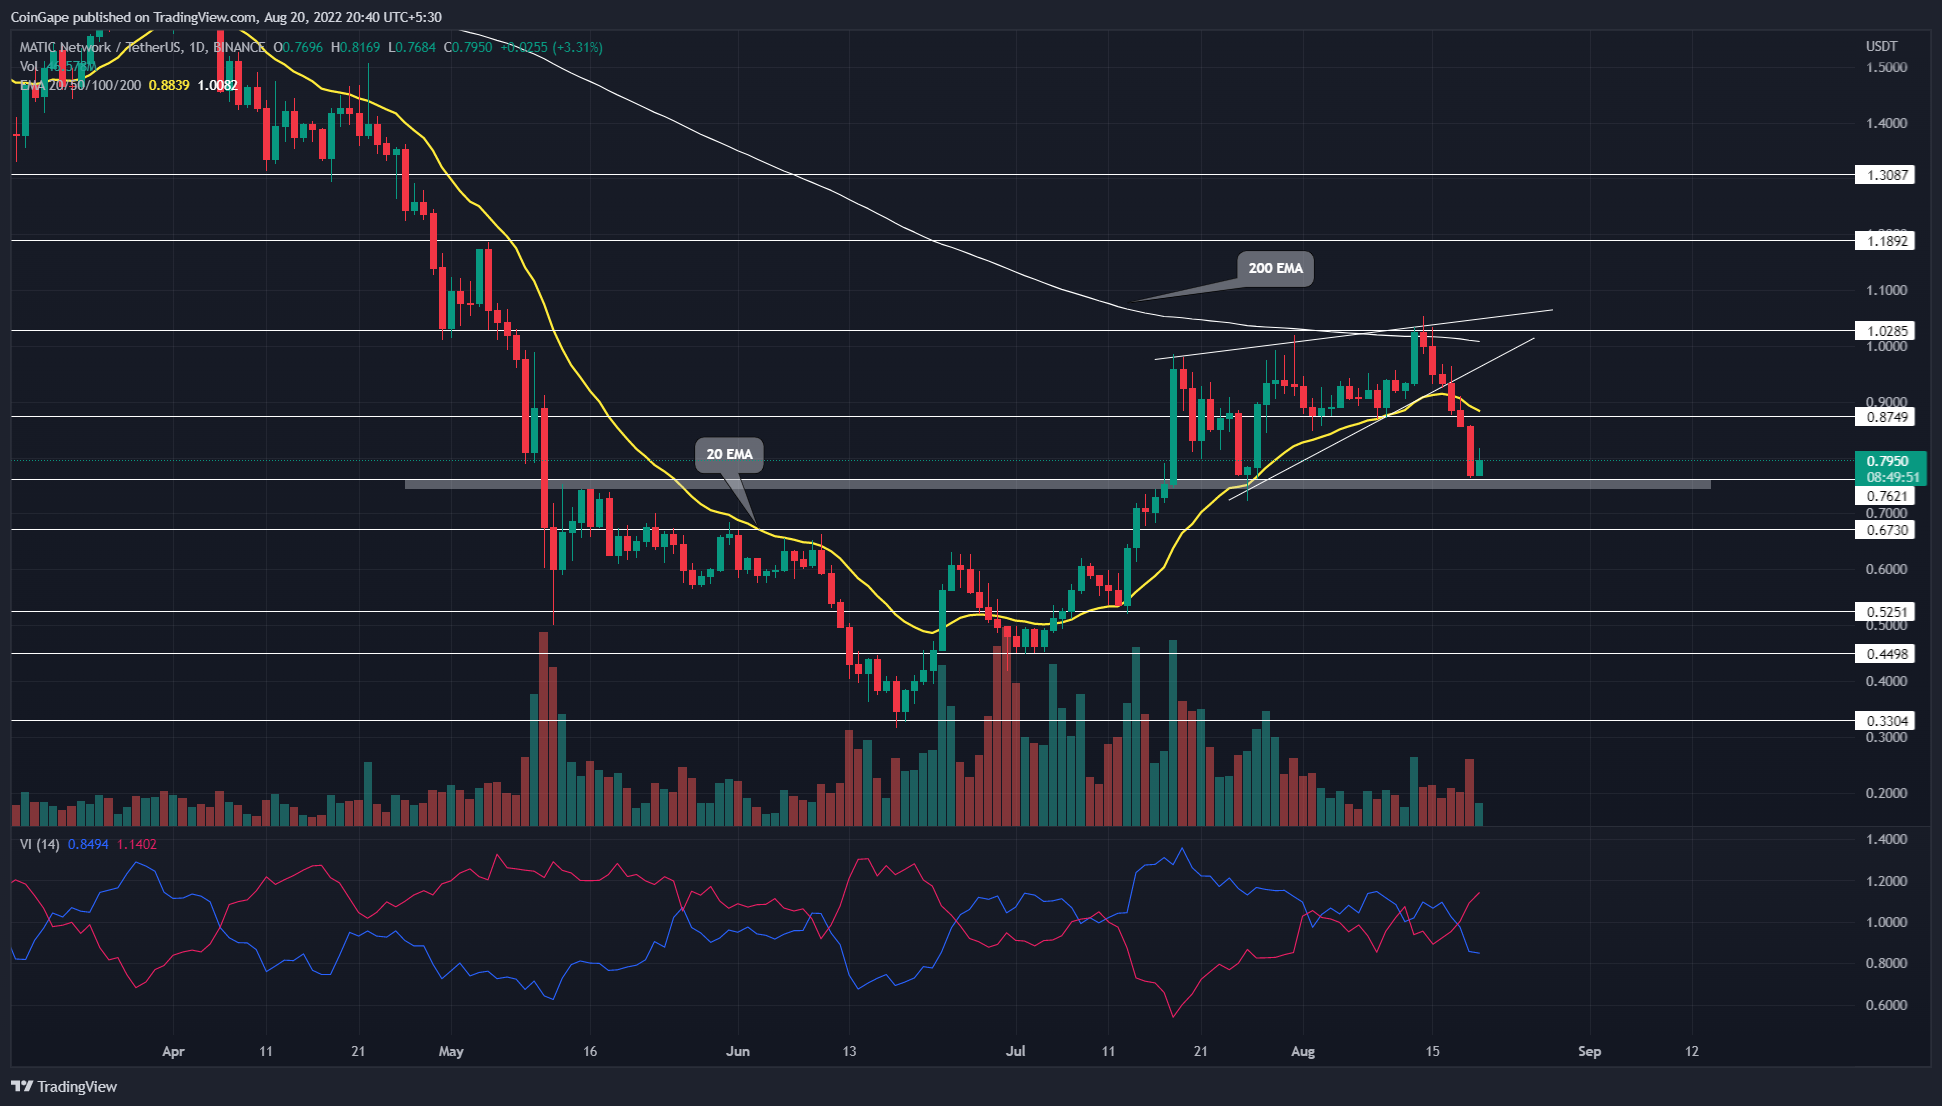 Source- –Tradingview
Amid the correction sentiment in the crypto market, the MATIC price gave a bearish breakdown from the pattern’s support trendline.
This pattern completion aligned with the recent news from the US Fed suggesting a 0.75% interest hike in September accelerated selling momentum. Thus, the post-breakdown rally tumbled the prices by 18%, where it hit the local support of $0.762.
This support level stalled the current correction phase and reverted the MATIC price to 4.35% higher, where it currently trades at $0.8. However, the bullish candle backed by low volume activity indicates weakness in bullish commitment.
Thus, an expected bullish reversal from the $0.762 level may trigger a temporary rally to stabilize the aggressive selling. Furthermore, the relief rally will likely hit the combined resistance of $0.875 and the 20-day EMA.
If sellers sustain the MATIC price below the $0.875 flipped resistance, the potential downfall could breach the $0.762 support and extend the current correction to $0.673.
On a contrary note, if the relief rally gives a candle closing above $0.875, the buyers will get another opportunity to reclaim $1.
Technical Indicators
EMAs: the MATIC price reverted from the 200-day EMA slope, indicating an overall bear trend. The coin price nosedive below the 20-day offers an extra edge to sellers.
Vortex indicator: A wide spread between the VI+ and VI- slope after a bearish crossover indicates rising selling pressure in the market. With no sign of weakness yet, the indicator bolsters the correction theory.
- Resistance levels- $0.875 and $1
- Support levels- $0.762 and $0.673
The presented content may include the personal opinion of the author and is subject to market condition. Do your market research before investing in cryptocurrencies. The author or the publication does not hold any responsibility for your personal financial loss.
Close Story
Leave a Reply