

V-shaped Recovery In Apecoin Price Next Targets $6.45 Mark

Published 2 hours ago
A five-day winning streak in Apecoin price reclaimed the $5 psychological resistance and tagged another resistance of $5.63. A possible breakout from this resistance will offer a higher footing for prices to bolster further price rally. However, a long wick rejection attached to the daily candle indicates the buyers face supply pressure at this resistance. So, is the correction phase not over?
Key points from Apecoin price analysis:
- The $5.63 breakout could push the prices 14.5% higher to hit the $6.45 mark.
- The rising prices reclaimed the 20-and-50-day EMA providing more confirmation for a bullish recovery
- The intraday trading volume in Apecoin is $475.6 Million, indicating a 146% gain
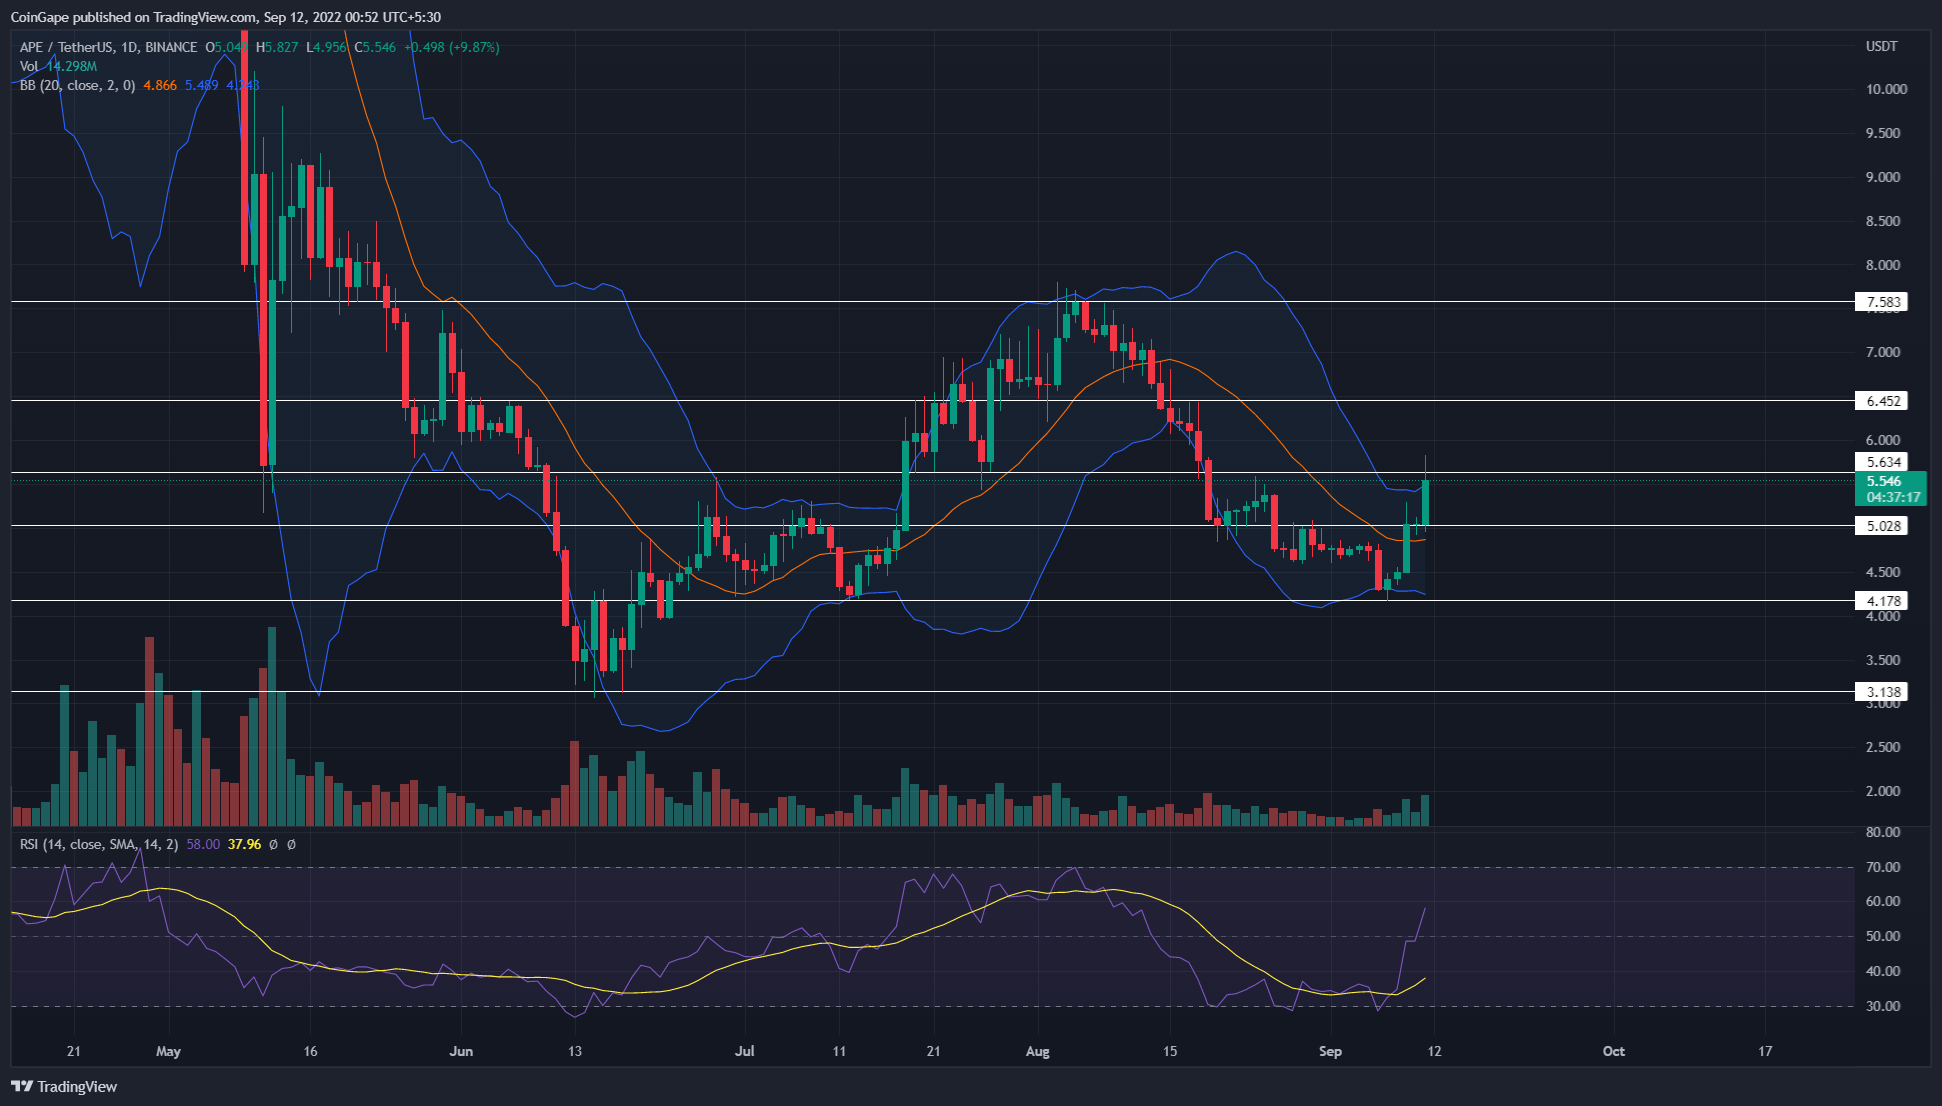 Source- Tradingview
The V-top reversal plunged the Apcoin price to shared support of 0.786 Fibonacci retracement level of $4.178. However, amid a sudden recovery in the crypto market, altcoin bounced back from this support.
The bullish reversal raised the Apecoin price for five consecutive days and accounted for 33.5% growth. Moreover, the bull run breached the immediate resistance of $5 and hit the local resistance of $5.63. With a 10.68% pump today, the coin price shows a breakout opportunity from the aforementioned resistance.
However, a retracement to such a low level as 0.786 FIB indicates weak bullish momentum. Therefore, the price action needs more confirmation to indicate the prior correction phase has ended.
Therefore, a bullish breakout of $6.45 resistance is needed to obtain a recovery opportunity for Apecoin holders. Doing so will encourage buyers to a 17% jump and challenge the last swing high resistance of $7.6.
On a contrary note, if the Apecoin reverted from $5.63 or $7.6 resistance, the coin holders would still be under correction threat.
Technical Indicator
Bollinger Band indicator: the coin price hits the indicator upper band, indicating buying activity has exceeded the usual price deviation. Thus, this retest is likely followed by minor correction before continuing the bull run.
RSI indicator: the daily-RSI slope jumps above the neutral line, indicating the market sentiment has turned positive.
- Resistance levels: $5.63 and $6.45
- Support levels: $5 and $4.1\
The presented content may include the personal opinion of the author and is subject to market condition. Do your market research before investing in cryptocurrencies. The author or the publication does not hold any responsibility for your personal financial loss.
Close Story
Leave a Reply