

Terra [LUNA]: Gauging the effects of a >200% two-day surge
[ad_1]
Disclaimer: The findings of the following analysis are the sole opinions of the writer and should not be considered investment advice.
The twin collapses of Terra’s UST stablecoin and LUNA fueled the market-wide crumble in May, a plunge that the investors are still recovering from. However, after this turmoil, Do Kwon and his team’s recovery efforts have rebooted LUNA. Also, its counterpart Terra LUNA Classic, alongside LUNA, have skyrocketed in the last few days.
The native token of Terra’s blockchain registered an over 200% ROI over the last two days. Even so, the coin was still down by 67.5% from its ATH, at the time of writing.
With a declining trend seen in its daily trading volumes, the price action seemed to consolidate within its up-channel (yellow) on the 4-hour timeframe.
A sustained revival can now find hindrances in the $6.5-$7 range.
At press time, LUNA was trading at $6.2965, up by 7.78% in the last 24 hours.
LUNA 4-hour Chart
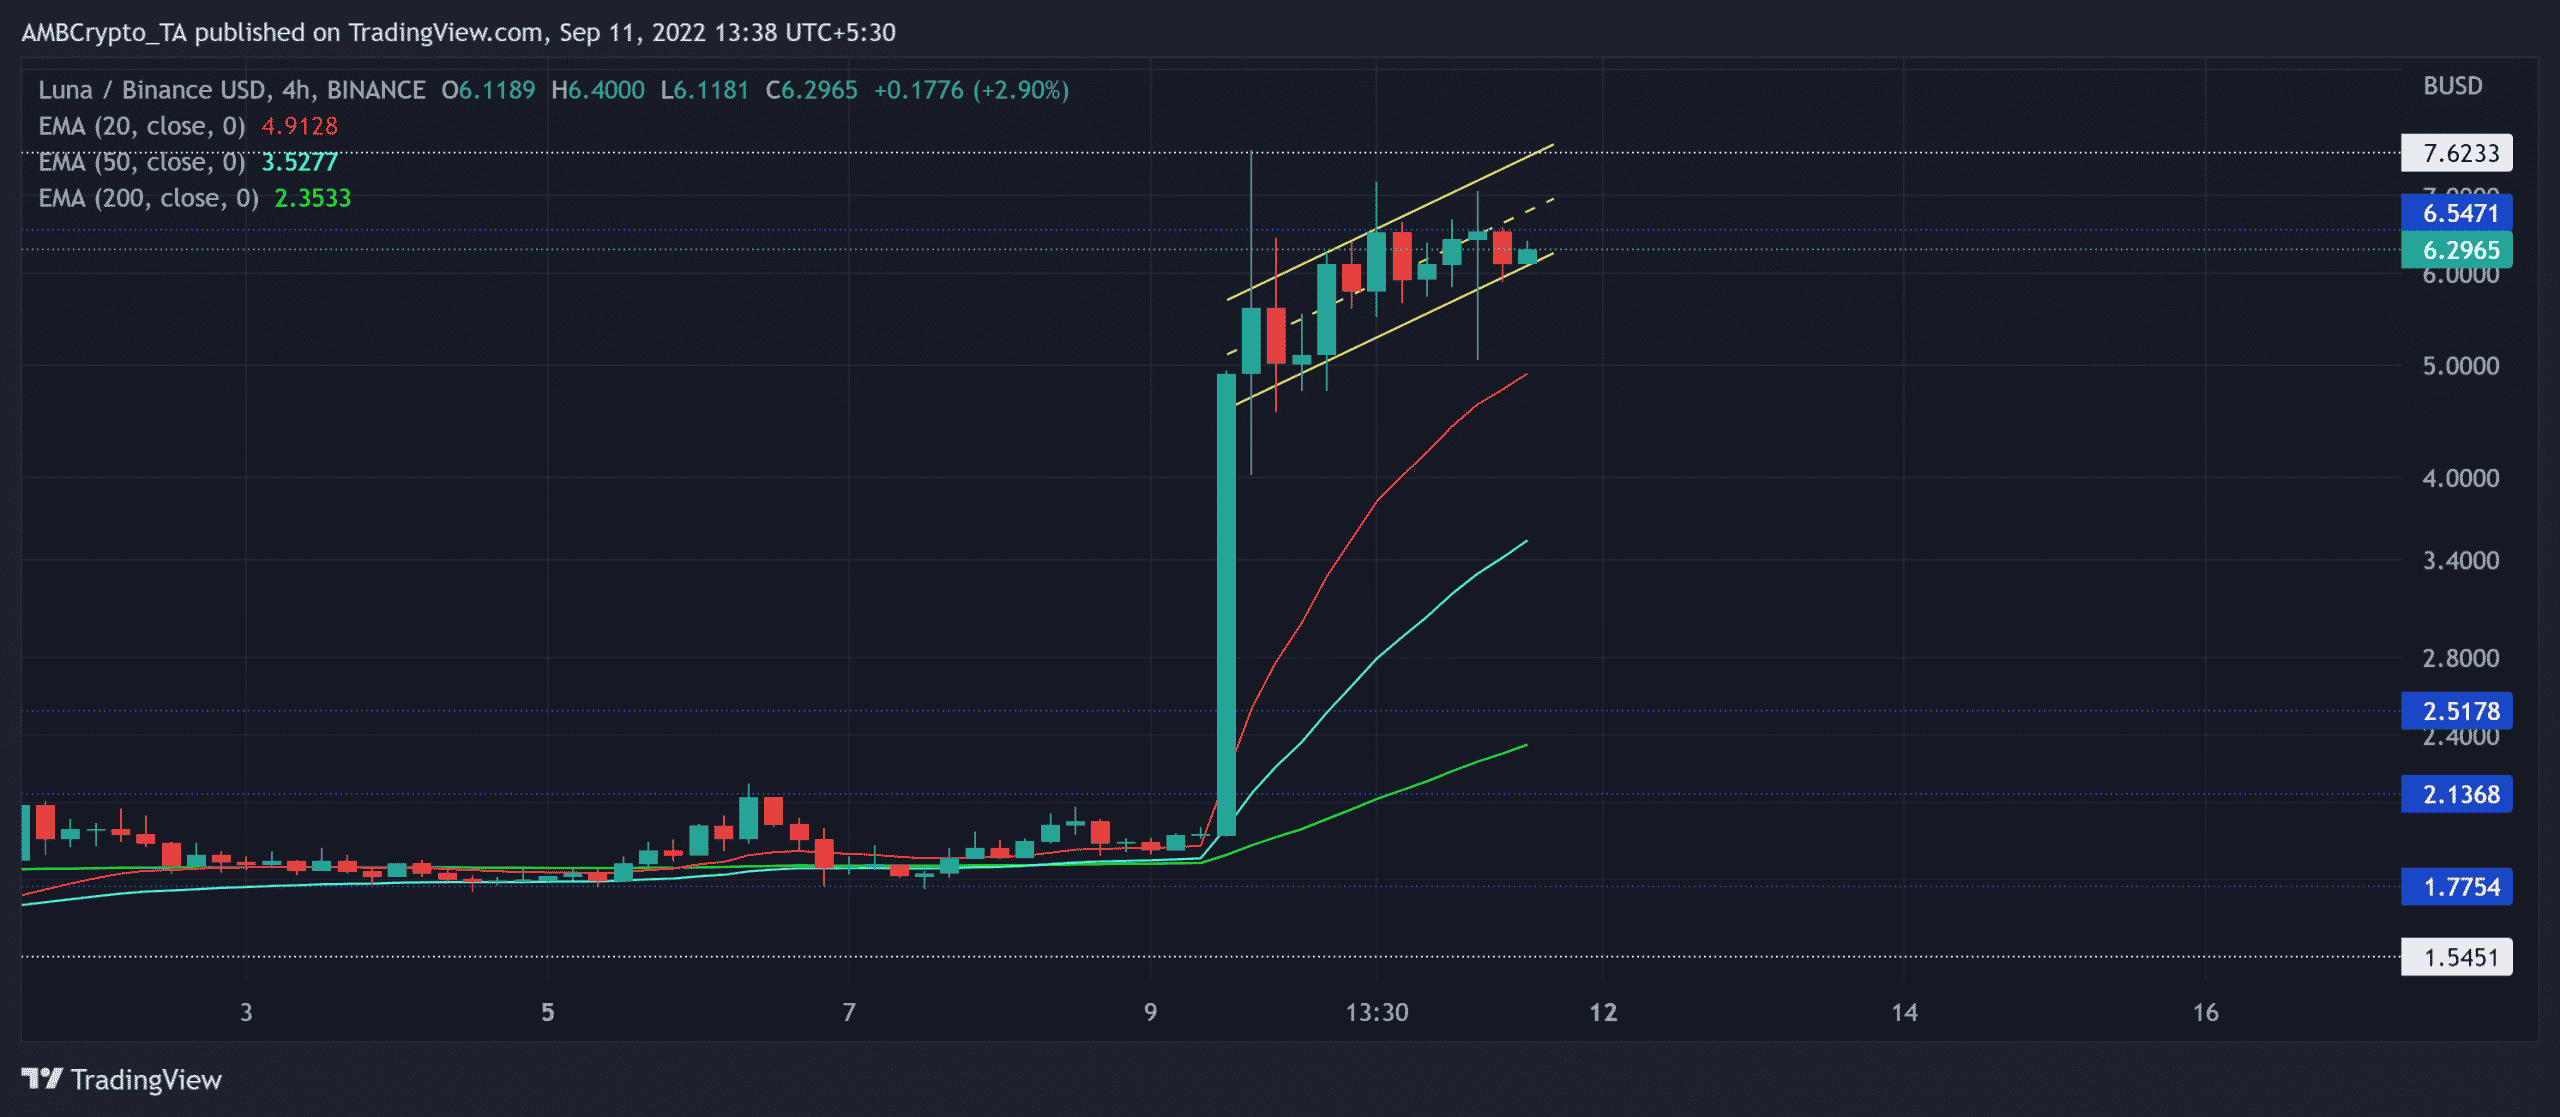
Source: TradingView, LUNA/BUSD
Since its all-time low on 29 August, LUNA regained its lost momentum to retest the $1.7-level. The break above this level flipped it from resistance to support while the bulls aimed to snap the $2.1-hurdle.
After testing this hurdle twice, the third test resulted in a breakout rally that put LUNA in price discovery. The altcoin witnessed a solid bullish engulfing candlestick on 9 September, one that aided the bulls in fixating a spot beyond the north-looking 20/50/200 EMA.
With bulls breaking the low volatility phase, the sellers could pose near-term bottlenecks near the upper trendline of the up-channel. A close above the $6.5-level would position LUNA for a test of the $7-$10 range before a likely reversal.
On the contrary, an immediate close below the pattern would hint at a near-term decline towards the $4.8-zone (20 EMA) before a plausible revival.
Rationale
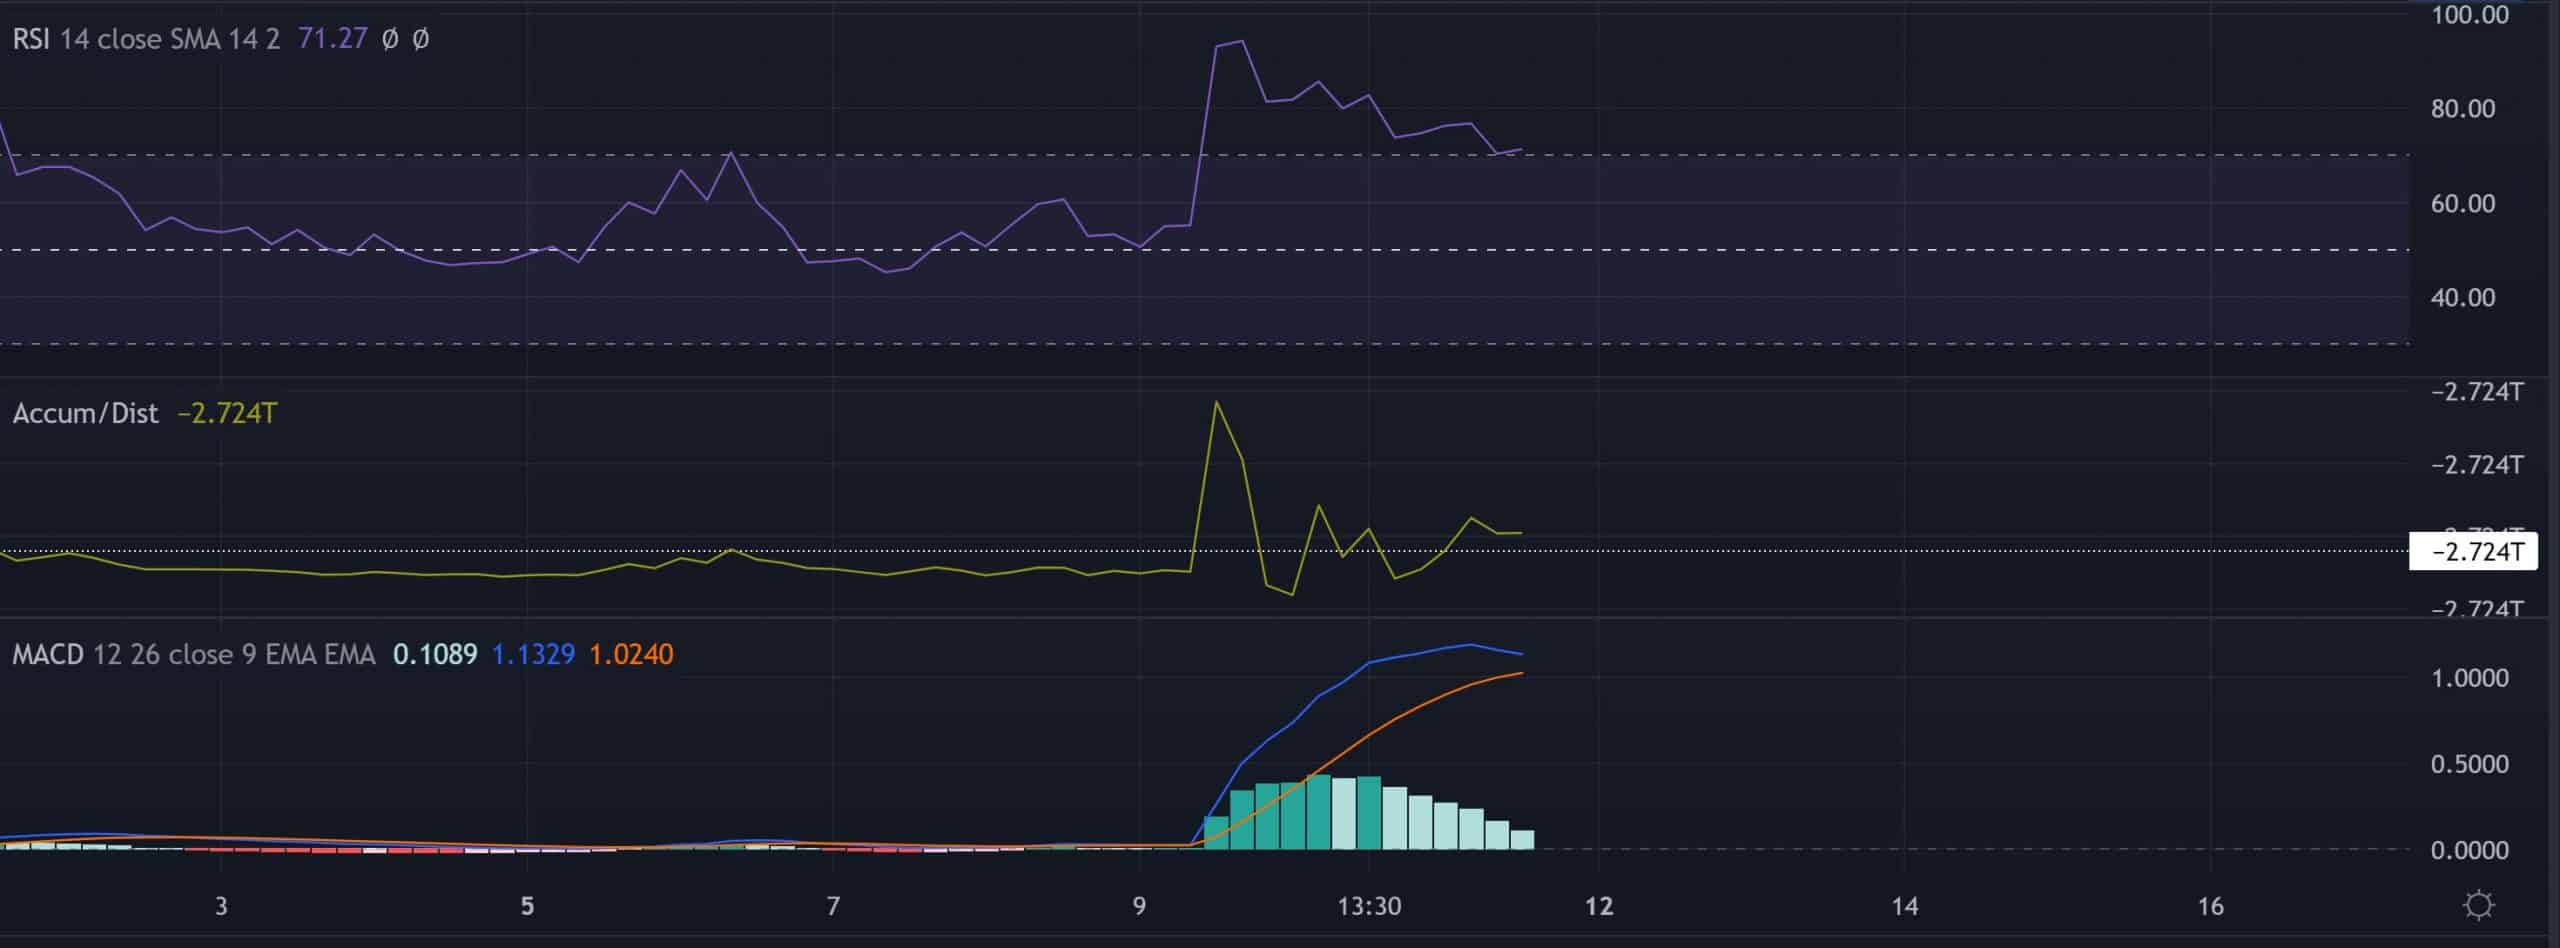
Source: TradingView, LUNA/BUSD
The heightened bullish pressure has kept the Relative Strength Index (RSI) in an overbought position. A gradual reversal from its record highs seemed likely in the coming sessions. Traders should wait for a decline below the 70-level support to confirm this bias.
Also, the Accumulation/Distribution (A/D) marked lower peaks and bearishly diverged with the price action. A sustained slowdown in the A/D could trigger a short-term downfall.
Nevertheless, the MACD lines were yet to undertake a bearish crossover and depicted a favorable bullish position.
Conclusion
In view of the severely overbought readings on LUNA’s RSI after its extended bull run, the altcoin could see a near-term sluggish phase. However, the north-looking EMAs and the MACD continue to show a strong bullish edge, meaning the buyers would look to snap the $6.5 resistance in the coming sessions. The targets would remain the same as discussed.
Finally, investors/traders must keep a close watch on Bitcoin’s movement. The latter could potentially affect the broader market sentiment.
[ad_2]
Source link
Leave a Reply