

Shiba Inu [SHIB] holders’ fortune prediction for next week
Disclaimer: The findings of the following analysis are the sole opinions of the writer and should not be considered investment advice.
As anticipated in the previous article, Shiba Inu [SHIB] snapped the $0.01217-mark after forming a bullish rectangle bottom setup. (For brevity, SHIB prices are multiplied by 1,000 from here on).
While sellers showed near-term resistance at the $0.017-mark, buyers would strive for continued growth amidst the recent bullish engulfing candlestick.
On the flip side, the sellers could aim to inflict a pullback toward the 20 EMA (red) before a likely rebound. At press time, SHIB traded at $0.01477, down by 6.8% in the last 24 hours.
SHIB Daily Chart
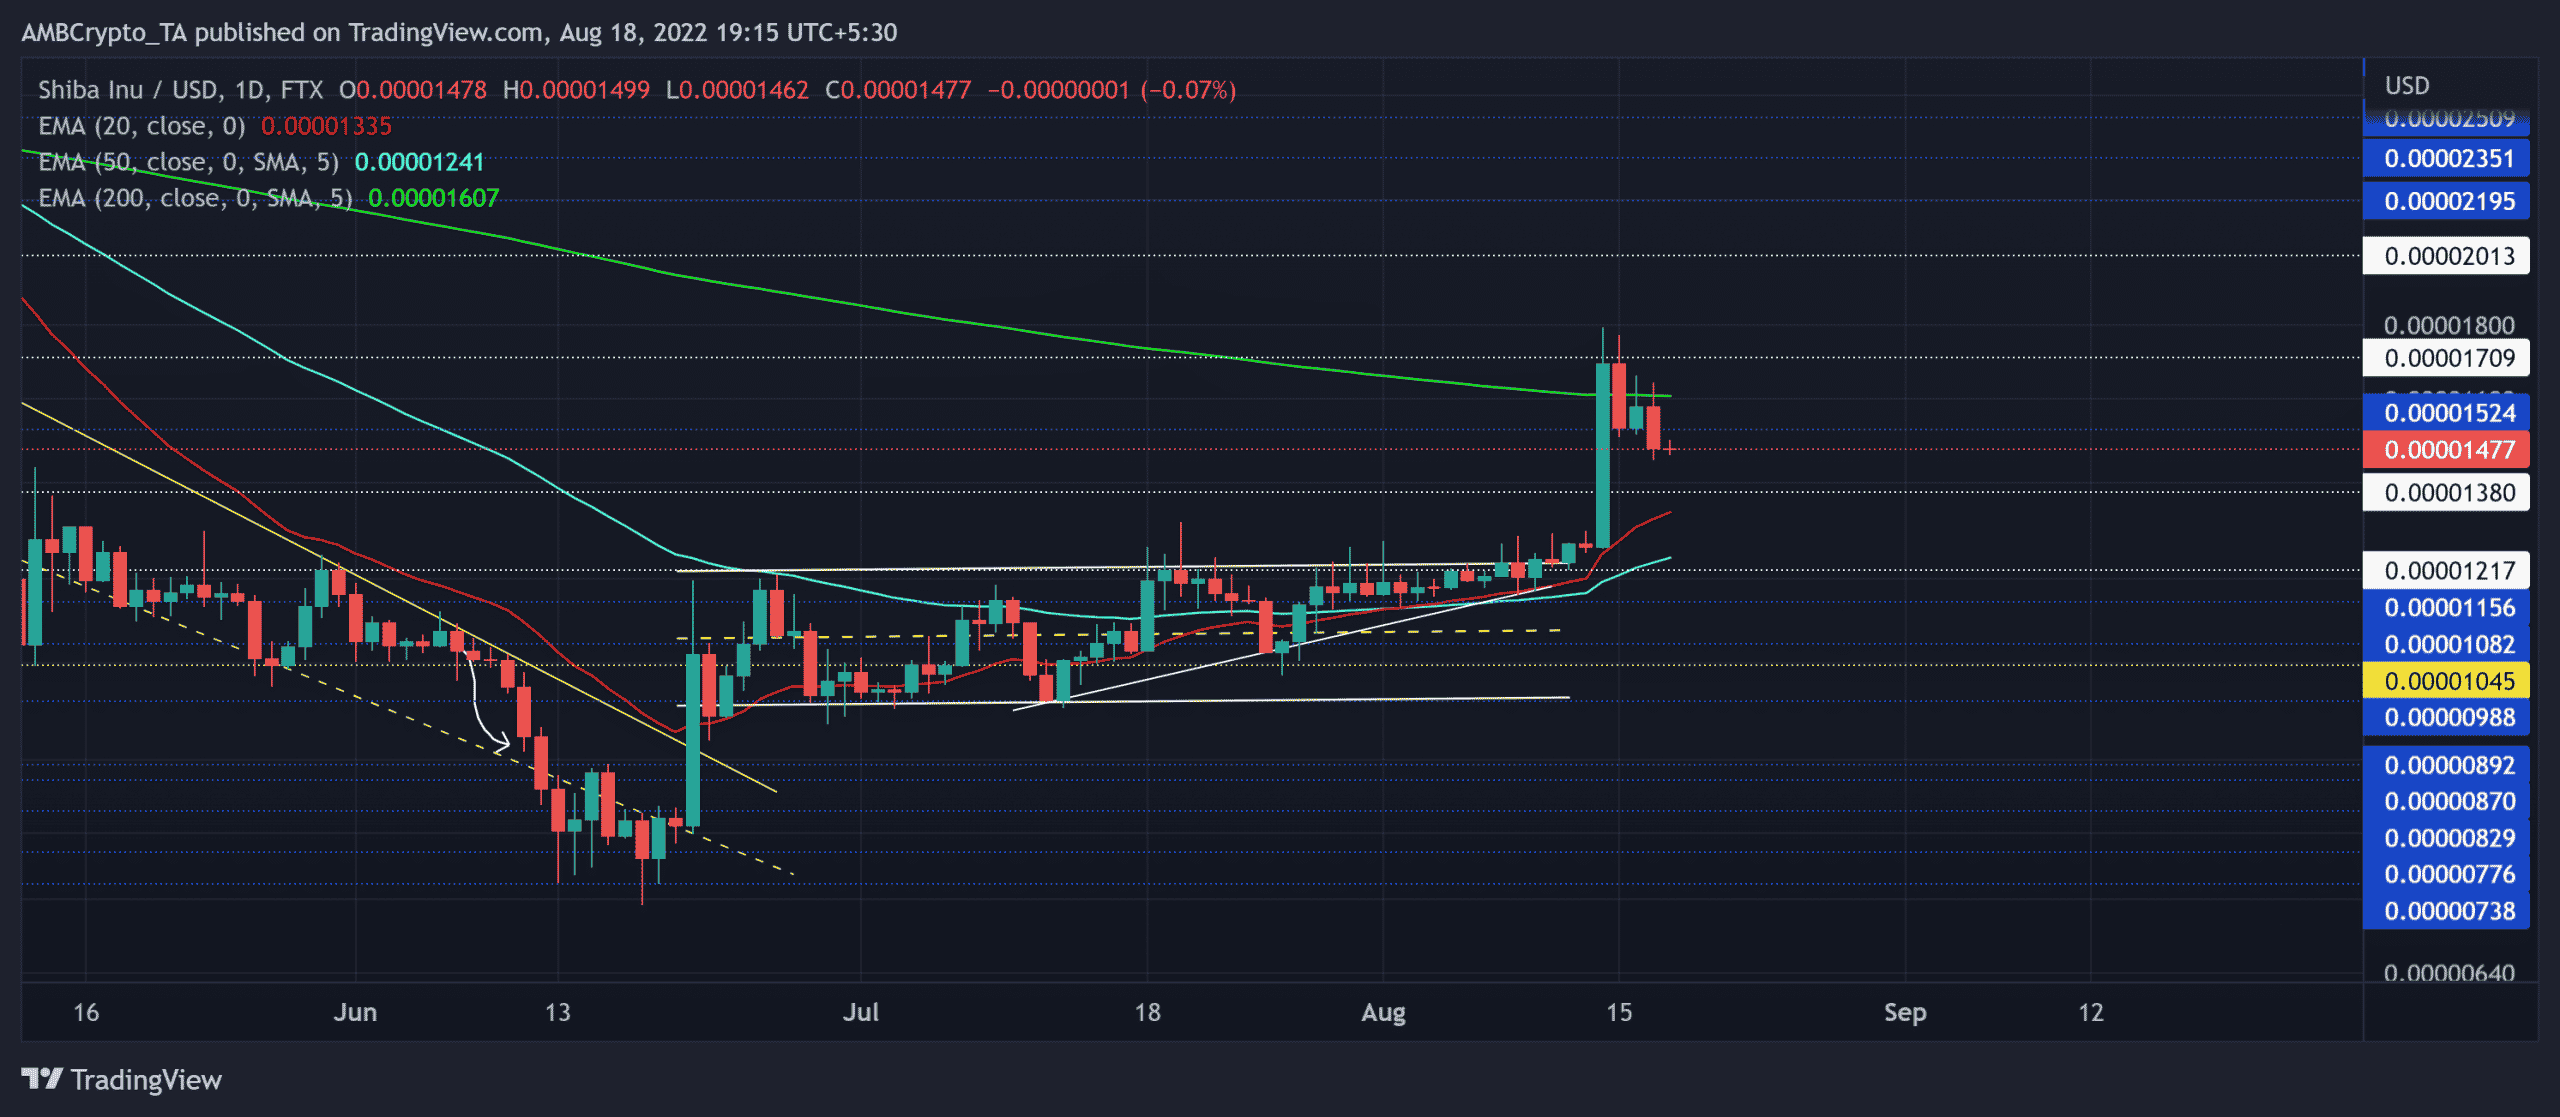
Source: TradingView, SHIB/USD
For over two months, SHIB buyers faced recovery barriers in the $0.01217 region. As a result, this choppy movement led to a sideways track in the daily chart.
Meanwhile, the bulls kept building up on their underlying pressure reflected in the form of higher lows over the last few weeks.
Consequently, SHIB formed an ascending triangle on the daily chart and reflected a visible bullish edge.
Further, the north-looking 20 EMA (red) and the 50 (cyan) assumed immediate support post their recent bullish crossover. The eventual break-out candlestick on 14 August entailed a massive uptick in buying volumes.
Owing to the bullish engulfing candlestick, an immediate recovery above the $0.0152-mark can make way for an extended recovery.
In this case, SHIB could witness a recovery toward the $0.017-$0.02 range. An inability to find a close above this mark would only provoke a sluggish phase near the EMAs.
Rationale
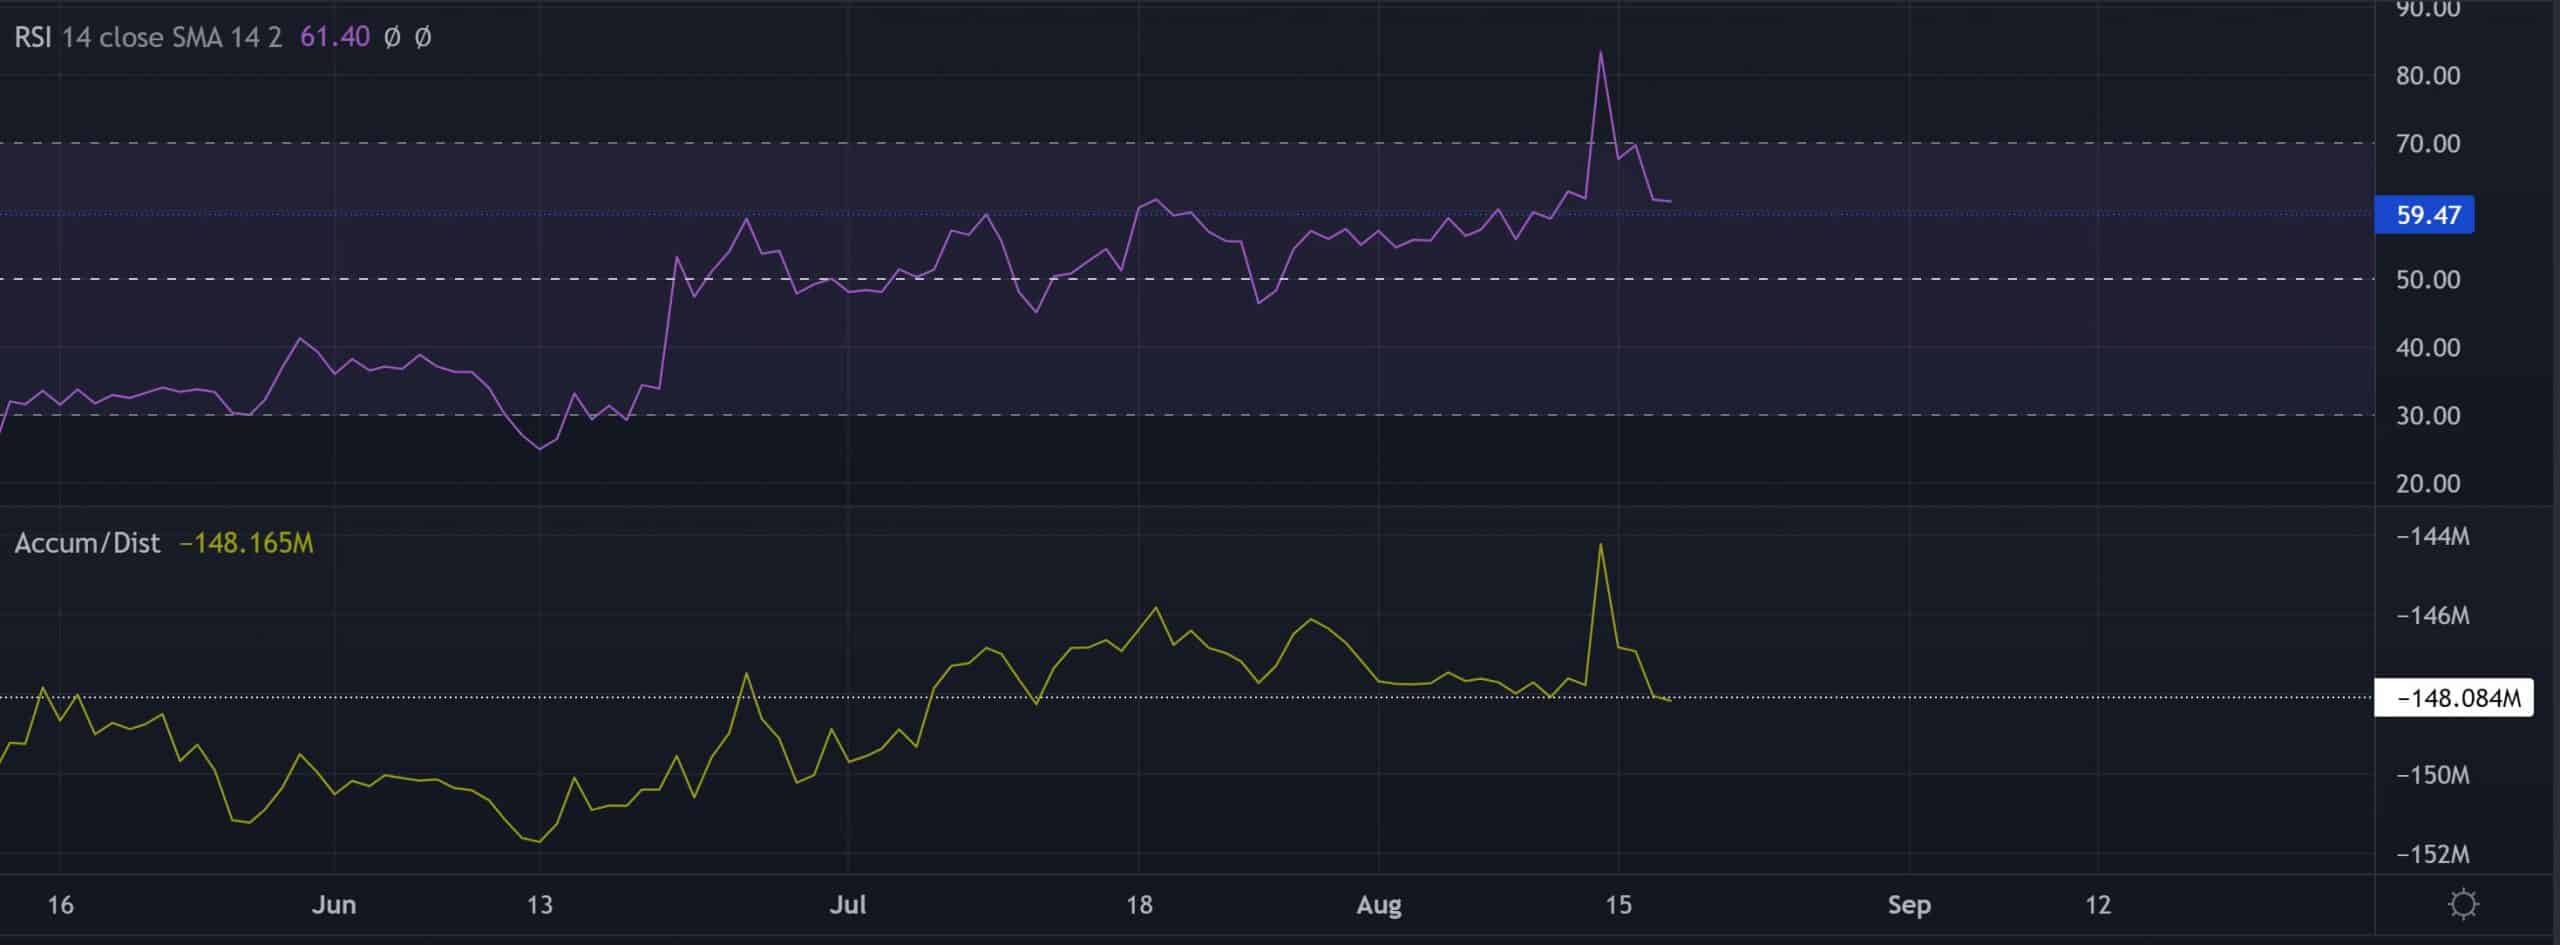
Source: TradingView, SHIB/USD
After swiftly piercing through the 70-mark, the overbought Relative Strength Index (RSI) saw a slight pullback over the last few days. The buyers must strive to maintain a spot above the 59-level support to heighten the chances of continued recovery.
Also, the Accumulation/Distribution indicator’s lower troughs were rather flat while bullishly diverging with the price. A sustained close below its immediate support could delay the near-term recovery prospects.
Conclusion
Given the bullish engulfing breakout candlestick on high volumes alongside the north-looking 20/50 EMA, buyers would strive to maintain their edge. Any reversals toward the 20 EMA could hint at a plausible dull phase. The targets would remain the same as discussed.
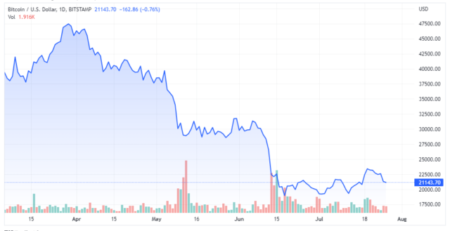
But the alt shares a 59% 30-day correlation with Bitcoin. Hence, keeping an eye on Bitcoin’s movement with the overall market sentiment could be essential to identify any bullish invalidations.


Leave a Reply