
Exchange Netflow Registers Negative Spike –
On-chain data shows the Bitcoin exchange netflow has registered a negative spike recently, a sign that may be bullish for the price.
Bitcoin Exchange Netflow Has Plunged In Recent Days
As pointed out by an analyst in a CryptoQuant post, a large negative spike in the netflow took place just yesterday. The “exchange netflow” is an indicator that measures the net amount of Bitcoin that’s entering into or exiting the wallets of all centralized exchanges. Its value is naturally calculated as the inflows minus the outflows.
When the value of this metric is positive, it means a net amount of BTC is entering the wallets of these platforms right now. Since one of the main reasons why investors would deposit their coins to the exchanges is for selling-related purposes, this kind of trend can have bearish implications for the asset’s value.
On the other hand, negative values of the indicator imply that outflows are overwhelming the inflows currently. Such a trend, when prolonged, can be a sign of accumulation from the holders, and hence, can be bullish for the price of the cryptocurrency.
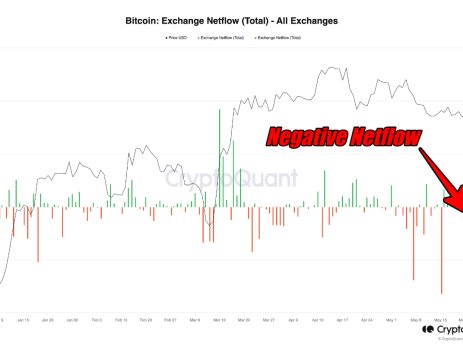
Now, here is a chart that shows the trend in the Bitcoin exchange netflow over the last few months:
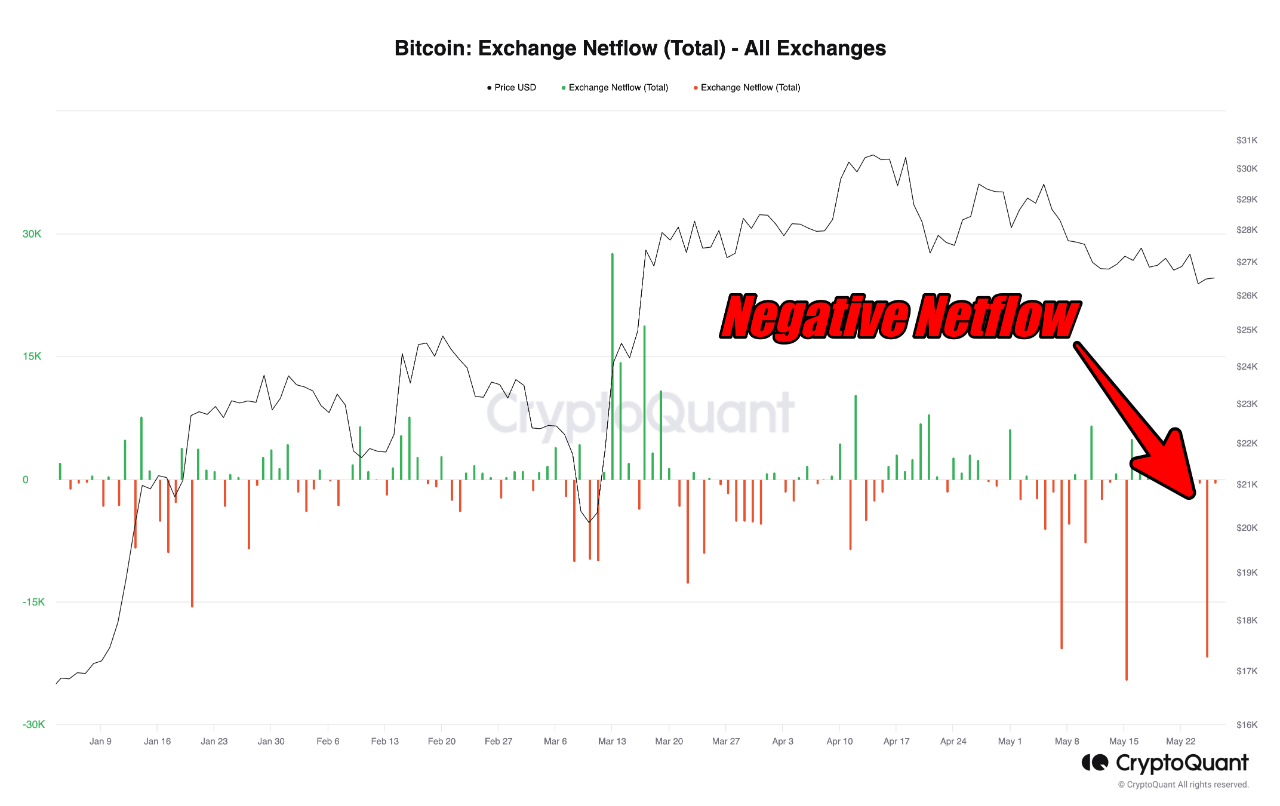
The value of the metric seems to have been quite negative in recent days | Source: CryptoQuant
As shown in the above graph, the Bitcoin exchange netflow observed a huge negative spike recently. This means that the investors have withdrawn a large number of coins from these platforms.
A couple of large negative spikes were also observed earlier in the month. The first of these came just after the asset’s price had slipped below the $28,000 level, while the second one came when the coin was wobbling around the $27,000 mark.
Both of these spikes may have been signs of some whales trying to catch the bottom during the decline. The latest plunge in the indicator has also come after the cryptocurrency has plummeted; this time towards the $26,000 level.
This new net outflow spike is the second largest that the indicator has registered this year, with only the withdrawals during the consolidation around the $27,000 level being greater in scale.
Naturally, even if these outflows are a sign of buying pressure in the market, it’s unlikely that they can turn the price around on their own; just like how the previous two spikes also failed.
However, it’s a positive sign for the cryptocurrency nonetheless, as it shows that at least some whales think that it’s worth buying the asset at the current prices. While perhaps not immediately, this can certainly help the price hit a bottom eventually.
The quant has also noted that the daily Relative Strength Index (RSI) of Bitcoin has also formed a possible bullish divergence recently, which may also be another factor to consider.
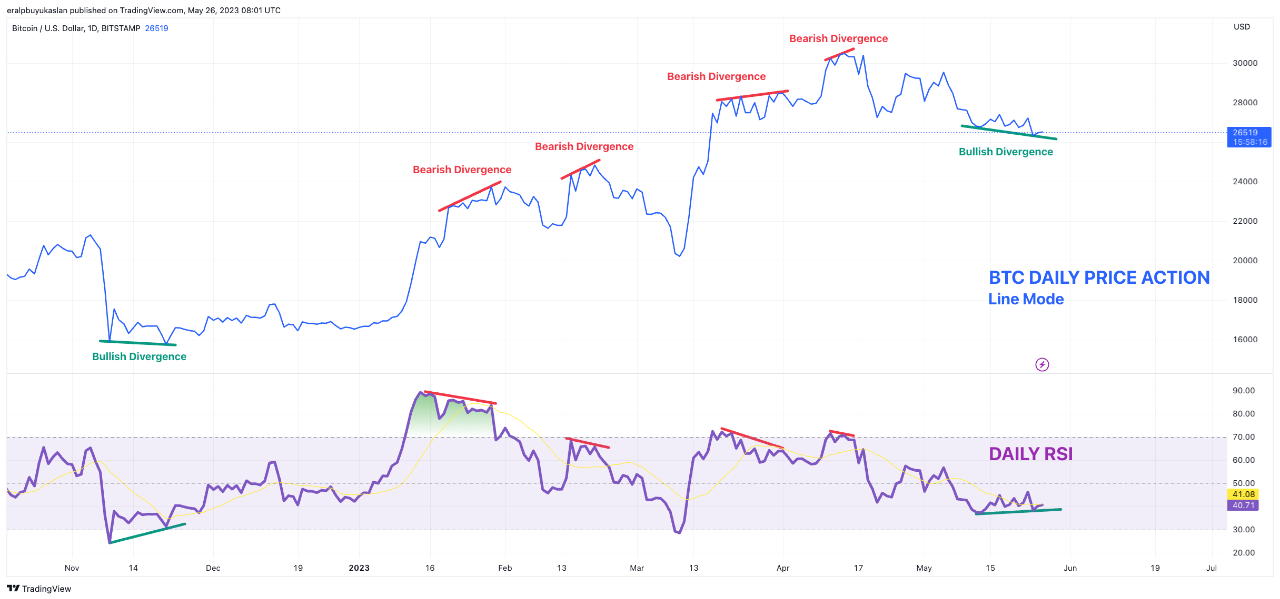
Looks like the price and the RSI have gone opposite ways recently | Source: CryptoQuant
BTC Price
At the time of writing, Bitcoin is trading around $26,800, up 1% in the last week.
BTC has been consolidating recently | Source: BTCUSD on TradingView
Featured image from iStock.com, charts from TradingView.com, CryptoQuant.com
Leave a Reply