

Consolidates Below $0.85; Is Time To Buy?

Published 1 hour ago
The Decentraland price analysis shows familiar sideways movement on Thursday. The price consolidates in a very tight range for the past few sessions. The recent price action is the result of the intense selling MANA faced on August 19. MANA price is trading with no clear directional bias.
As of publication time, MANA/USD is reading at $0.82, down 0.55% for the day. The 11th-largest cryptocurrency by the market cap holds the 24-hour trading volume down 2% at $2.90 billion.
- Decentraland price consolidates for the sixth straight session on Thursday.
- A breakdown of the rising channel indicates the overall bearish sentiment.
- A daily candlestick below $0.81 would strengthen the bearish outlook.
Decentaland Price is in limbo looking for a clear directional setup
MANA price trades at $0.82, 81% below the year 2022 high around $3.55. After testing the high, the price has been trading in a descending channel.
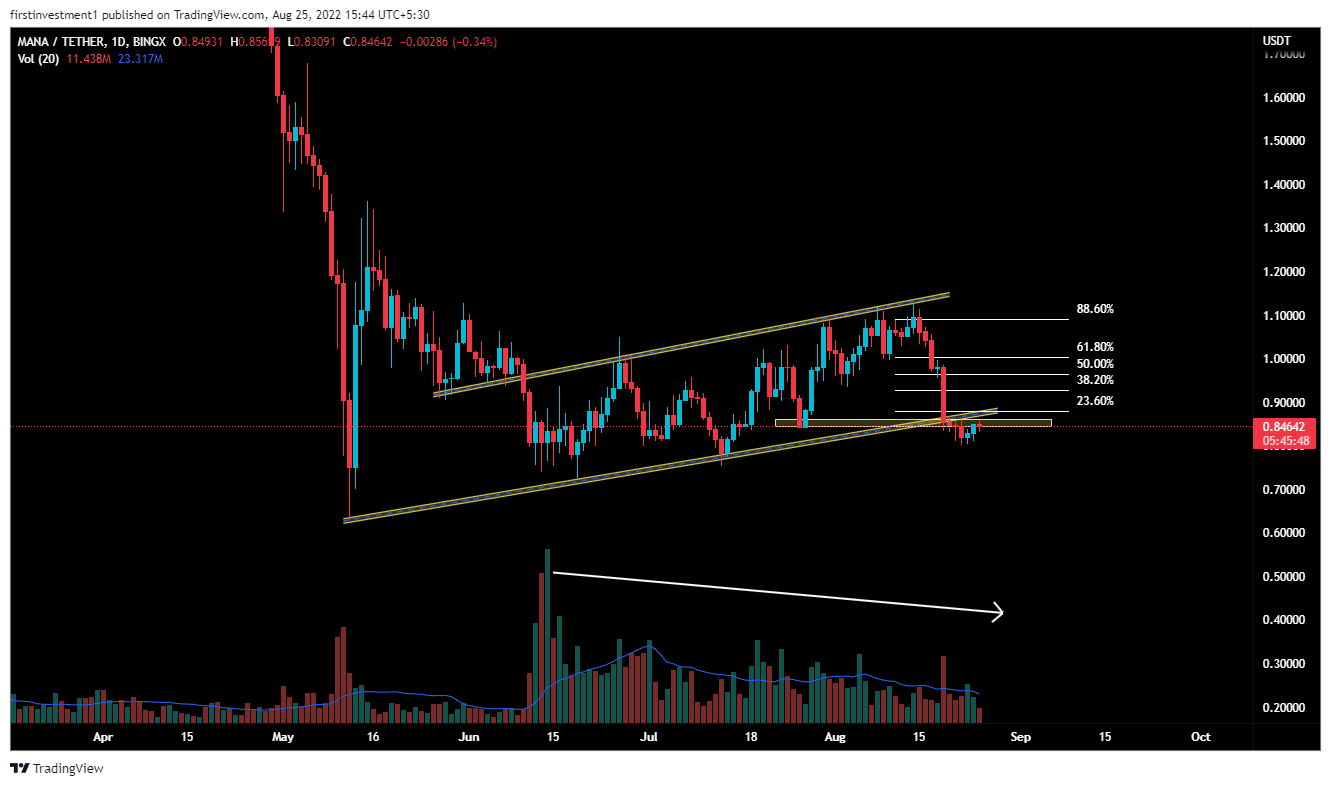
On the daily chart, MANA gave a breakdown of the “Rising Channel” pattern, which extends from the lows of $0.59 made on May 12. However, the price broke the lower trend line on August 21.
An impulse fall was witnessed in the price from the resistance with a nearly 25% loss. MANA breakdown its previous swing low, making lower lows on the daily chart. The volumes were declining, with the rising price of a MANA, which implied a concern for the bulls. When the market is rising while volume is declining, big money is not the one buying, more likely slowly exiting positions.
There is a higher probability of price giving a pullback, before giving any sharp fall again in the coming future. We can expect a pullback between 38.2% ($0.926) to 50% ($0.9685). Fibonacci retracement levels. The “Buy on Selling” opportunity is the best course of plan to go with.
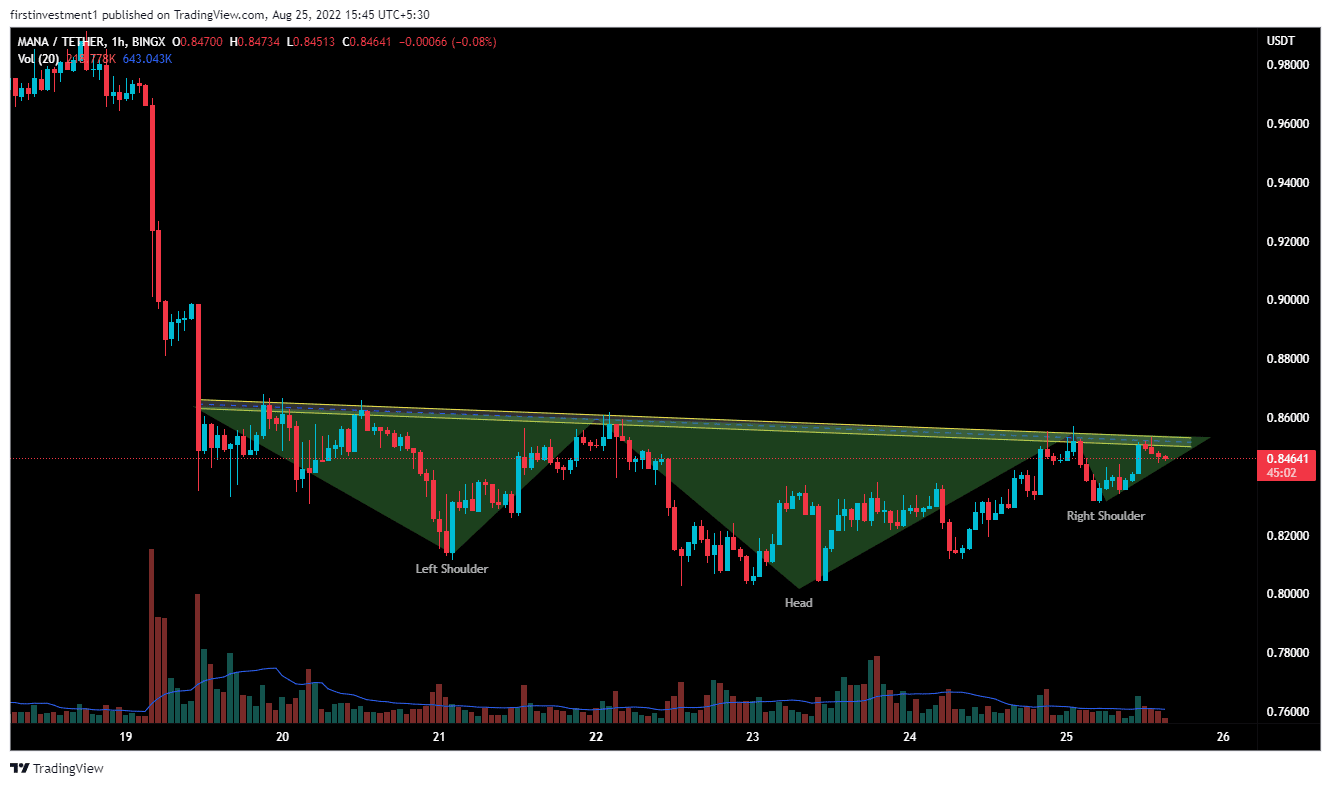
MANA on the hourly chart formed a bullish “Head & Shoulder” pattern.
Now, if the price gave a closing above $0.85 on the hourly chart amid sustained buying, we can expect a bullish momentum up to the pullback levels, mentioned above.
The nearest support is the swing low, which is $0.82, and the nearest resistance is at $0.85. There is a higher probability of the price breaking the upper level on a lower level.
Also read: Crypto Company Plans To Go Public Amid Bear Market
The formation of several Doji candlesticks suggests indicates consolidation near the lower level. A decisive break above the $0.85 level would bring gains in the coin. Further, the bulls would aim for $1.03
XTZ is sideways on all time frames. A spike in buy order could push the price to a higher level, we’ll put a buy trade.
The presented content may include the personal opinion of the author and is subject to market condition. Do your market research before investing in cryptocurrencies. The author or the publication does not hold any responsibility for your personal financial loss.
Close Story
Leave a Reply