

BTC Price Analysis- Volume Activity Hints Bitcoin could Hold $22000 Mark

Published 3 seconds ago
On July 19th, the Bitcoin (BTC) price escaped from a month-long consultation with a bullish breakout from the $22600-$20000 resistance zone. Since then, the price has been under a retest phase and pullbacks to the $20000 mark. This flipped support may act as a suitable launchpad to drive the prices higher.
Key points:
- The post-retest rally should drive the BTC price to the $26000 mark
- The $20000 support breakdown would invalidate the bullish thesis
- The intraday trading volume in Bitcoin is $25.5 Billion, indicating a 17% loss
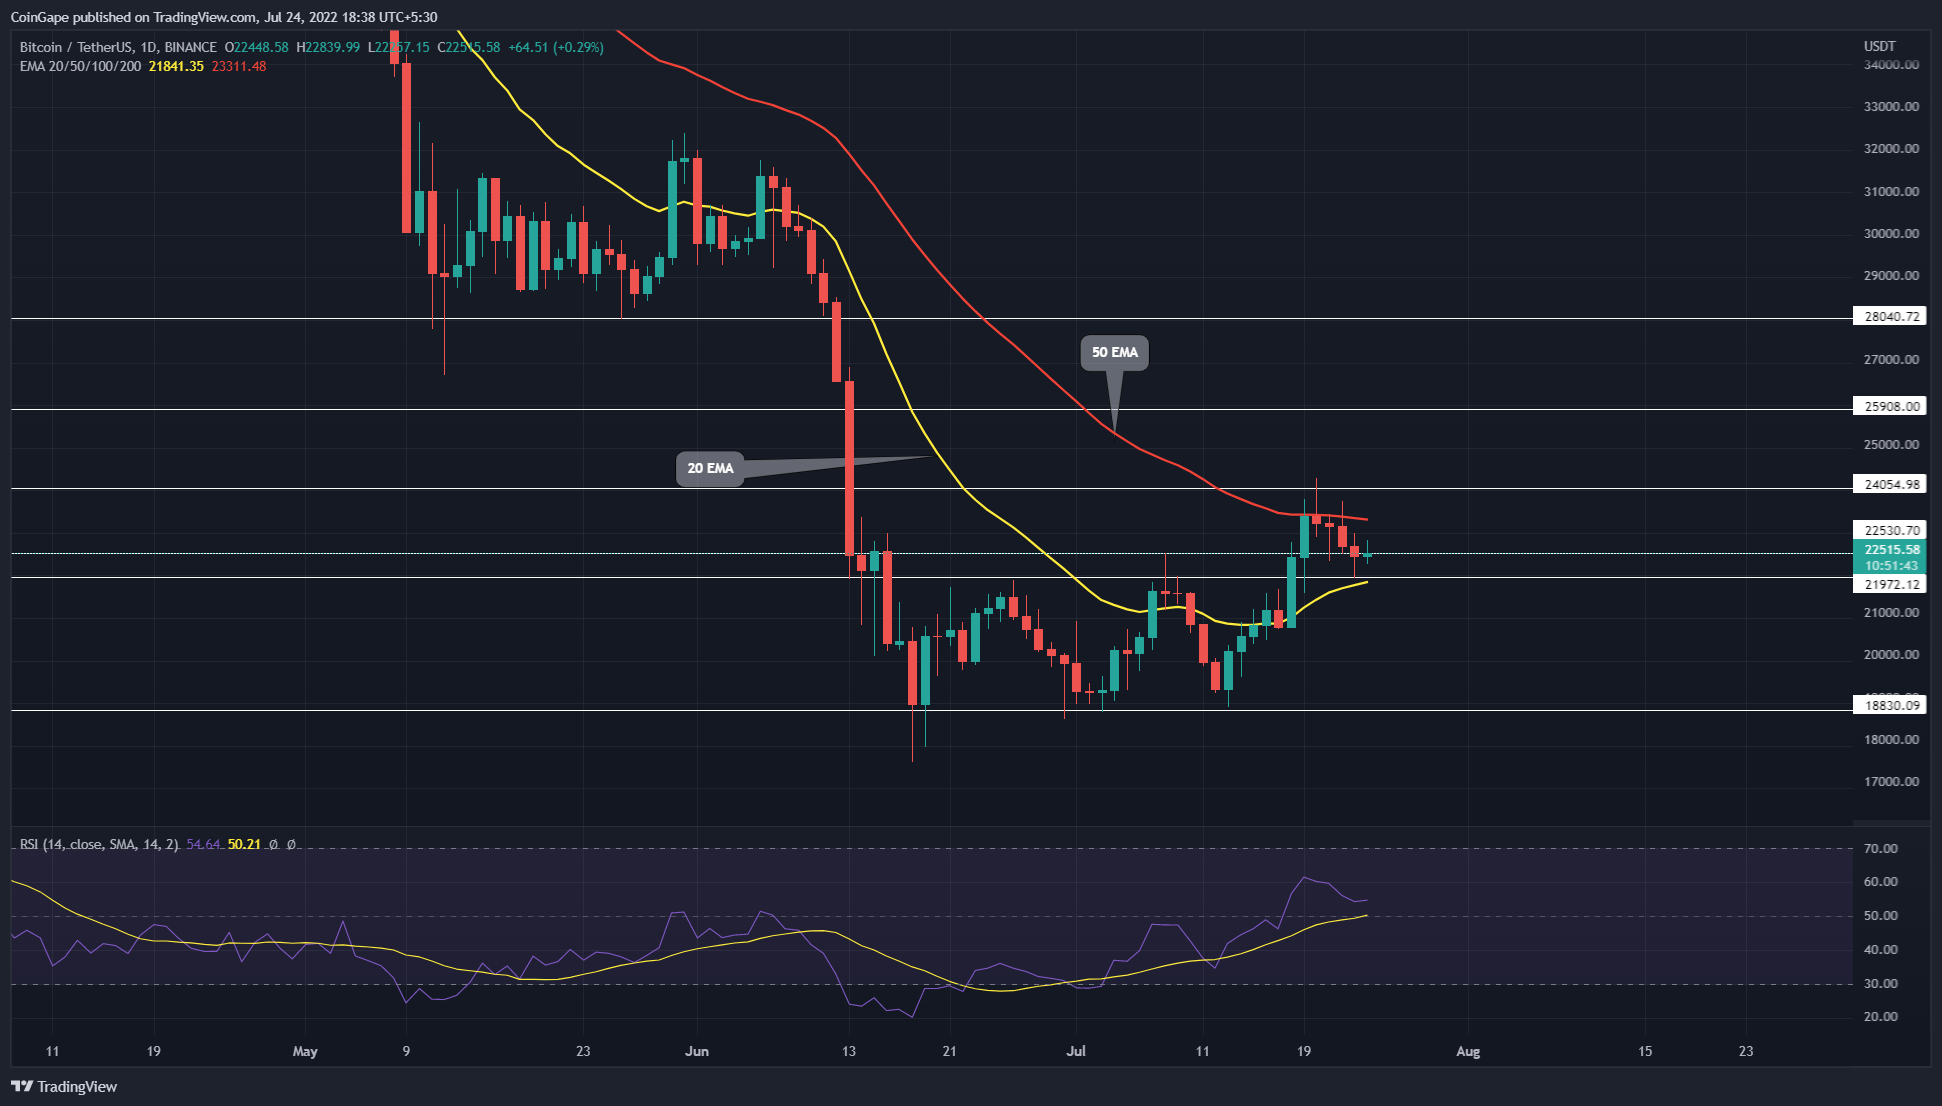 Source-Tradingview
From Mid-June-to-July, the BTC/USDT pair consolidated between the $22600 and $18900 barriers, reflecting uncertainty in the crypto market. However, earlier this week, the altcoin witnessed a significant inflow, which breached the overhead resistance($22600).
Furthermore, with a significant rise in volume activity, the breakout rally reached a high of $24196. Moreover, the coin chart showed an immediate reversal backed by low volume activity, indicating a retest to the breached $22600-$22000 resistance.
This decreasing volume during the retest phase accentuates the traders are less interested in entering a short position, thereby giving buyers an upper hand. Today, the BTC price is up 1.2% and reflects sustainability above the flipped support.
If the volume activity picks up on this green candle, the buyers will obtain a suitable signal to continue the bullish recovery.
The potential rally should surpass the $24000 resistance and surge 15% to the $26000 mark.
While things look favorable for buyers, a daily candlestick closing below the $22000 support would undermine the breakout thesis and may plunge the coin price back to the bottom support of $19000.
Technical Indicator
EMAs: BTC price action is heavily influenced by the 20-and 50-day EMAs. While the 50 EMA restricts the potential rally to reach higher, and the 20-day flipped support prevents a major correction. However, the buyers would acquire an extra edge if the expected rally managed to reclaim the 50 EMA.
RSI indicator: the daily-RSI slope sustains above the neutral zone despite a minor correction in price action, indicating the traders feel optimistic about Bitcoin’s recovery.
- Resistance level- $24000 and $26000
- Support level- $22000 and $19000
The presented content may include the personal opinion of the author and is subject to market condition. Do your market research before investing in cryptocurrencies. The author or the publication does not hold any responsibility for your personal financial loss.
Close Story
Leave a Reply