

BTC Holds Near 20-day EMA; Is Correction Over?

Published 42 mins ago
Bitcoin price analysis indicates probable exhaustion of the correction. The price opened with a negative bias and fell to spot the intra-day lows of $22,669. The support is coming from the 20-day exponential moving average.
With the renewed buying pressure, the buyers managed to reclaim the $24,000 mark. The hourly chart already points to a bounce back as the price reached the support zone after a swift recovery from the lows.
- Bitcoin price edges higher following a dull movement on Wednesday.
- The price found reliable support at the 20-day EMA at $22,800.
- A daily candlestick above $23,200 would bring more gains in the coin.
The bitcoin Fear and Greed Index fell 11 points to 31 from 42 in the last trading session. It indicates the bearish sentiment is prominent in the market.
BTC price consolidates
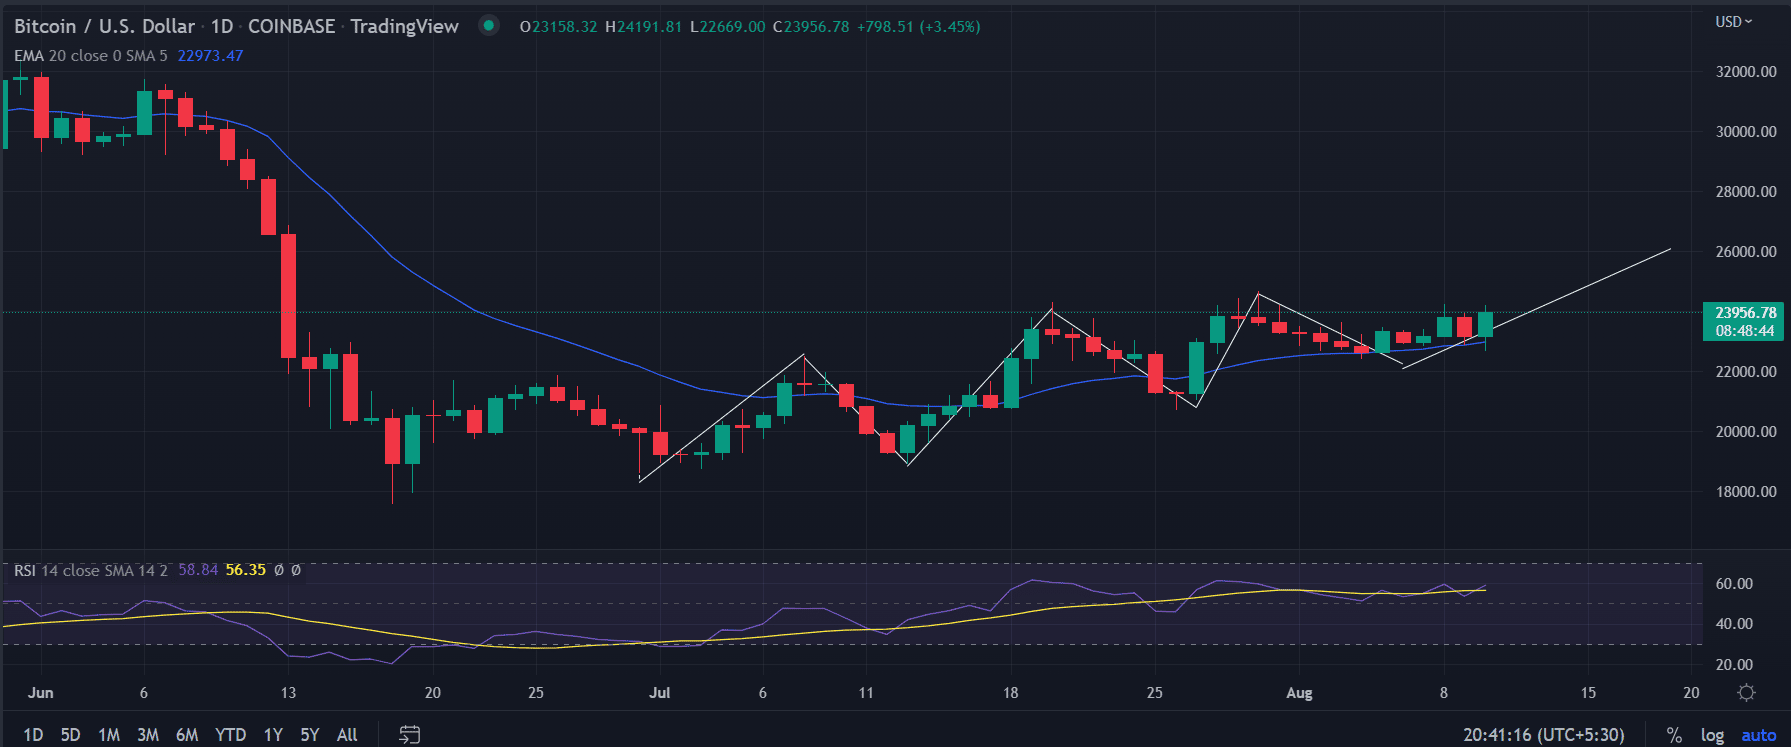
On the daily chart, the Bitcoin price analysis indicates the price is forming a higher-high and higher-low formation. Lately, the price failed to follow the trend.
After making a swing high of $24,666, the price form a lower high around $24,251. But, the interesting part is the formation of double support of around $22,800. This also coincides with the 20-day EMA. Thus, making it a crucial level to trade.
Now, a following green candlestick on the daily basis could form the base for the next upside movement in the largest cryptocurrency pair. The first upside filter could be found at Monday’s high of $24,250.Additional buying pressure could break the triple top structure near $24,250. If that happens then the gates would be open for the $26,000 psychological level.
The On-balance Volume (OBV) indicator suggests falling volume with a fall in price.
On the flip side, a break below the session’s low would reverse the prevailing trend. On moving lower, the bears would first tag $22,000 followed by the lows of July 27 at $21,045.
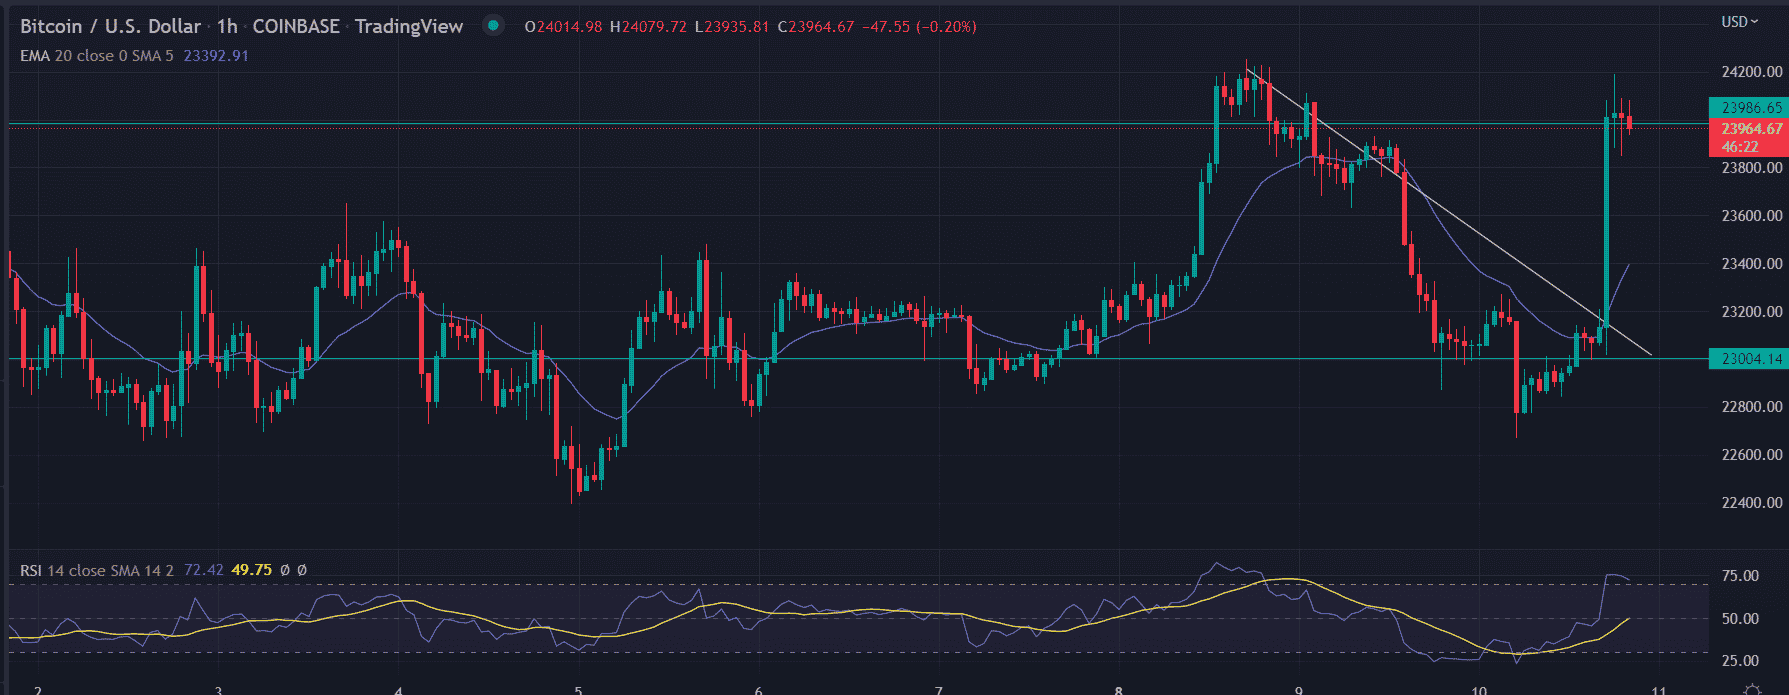
On the hourly time frame, the price recovered quickly from stable support near $22,800 and breached the $23,200 horizontal resistance zone.
Also read:
A move above the 20-day EMA would pave the way for the next horizontal support zone at $23,929.35. The price zoomed above the descending trend line from the highs of $24,227.09, indicating the underlying bullish sentiment.
The RSI indicator rises from the oversold zone and reached the overbought zone, resulting in a bounce back in the prices toward $24,000. Now, a consolidation around the high level would pave the way for further gains.
As of publication time, BTC/USD is reading at $23,937, up 3.41% for the day. The trading volume rose 12% at $28,060,872,683 according to CoinMarketCap data.
Support: $22,800
Resistance: $23,900
The presented content may include the personal opinion of the author and is subject to market condition. Do your market research before investing in cryptocurrencies. The author or the publication does not hold any responsibility for your personal financial loss.
Close Story
Leave a Reply