

Bitcoin Cash [BCH]: All you need to know before you write off this alt
Sharing a statistically significant positive correlation with the leading coin Bitcoin [BTC], Bitcoin Cash [BCH] logged a decline in its price in the last week. According to data from the cryptocurrency analytics platform CoinMarketCap, the price per BCH coin fell by 8% in the past seven days.
Data from Santiment showed that the consistent decline in the price of the asset pointed to BCH distribution by investors.
Also, the surge in BCH’s trading volume and the lack of a corresponding price rally during intraday trading hours on 13 October hinted at buyers’ exhaustion. As per CoinMarketCap, BCH’s trading volume had rallied by 65% in the last 24 hours.
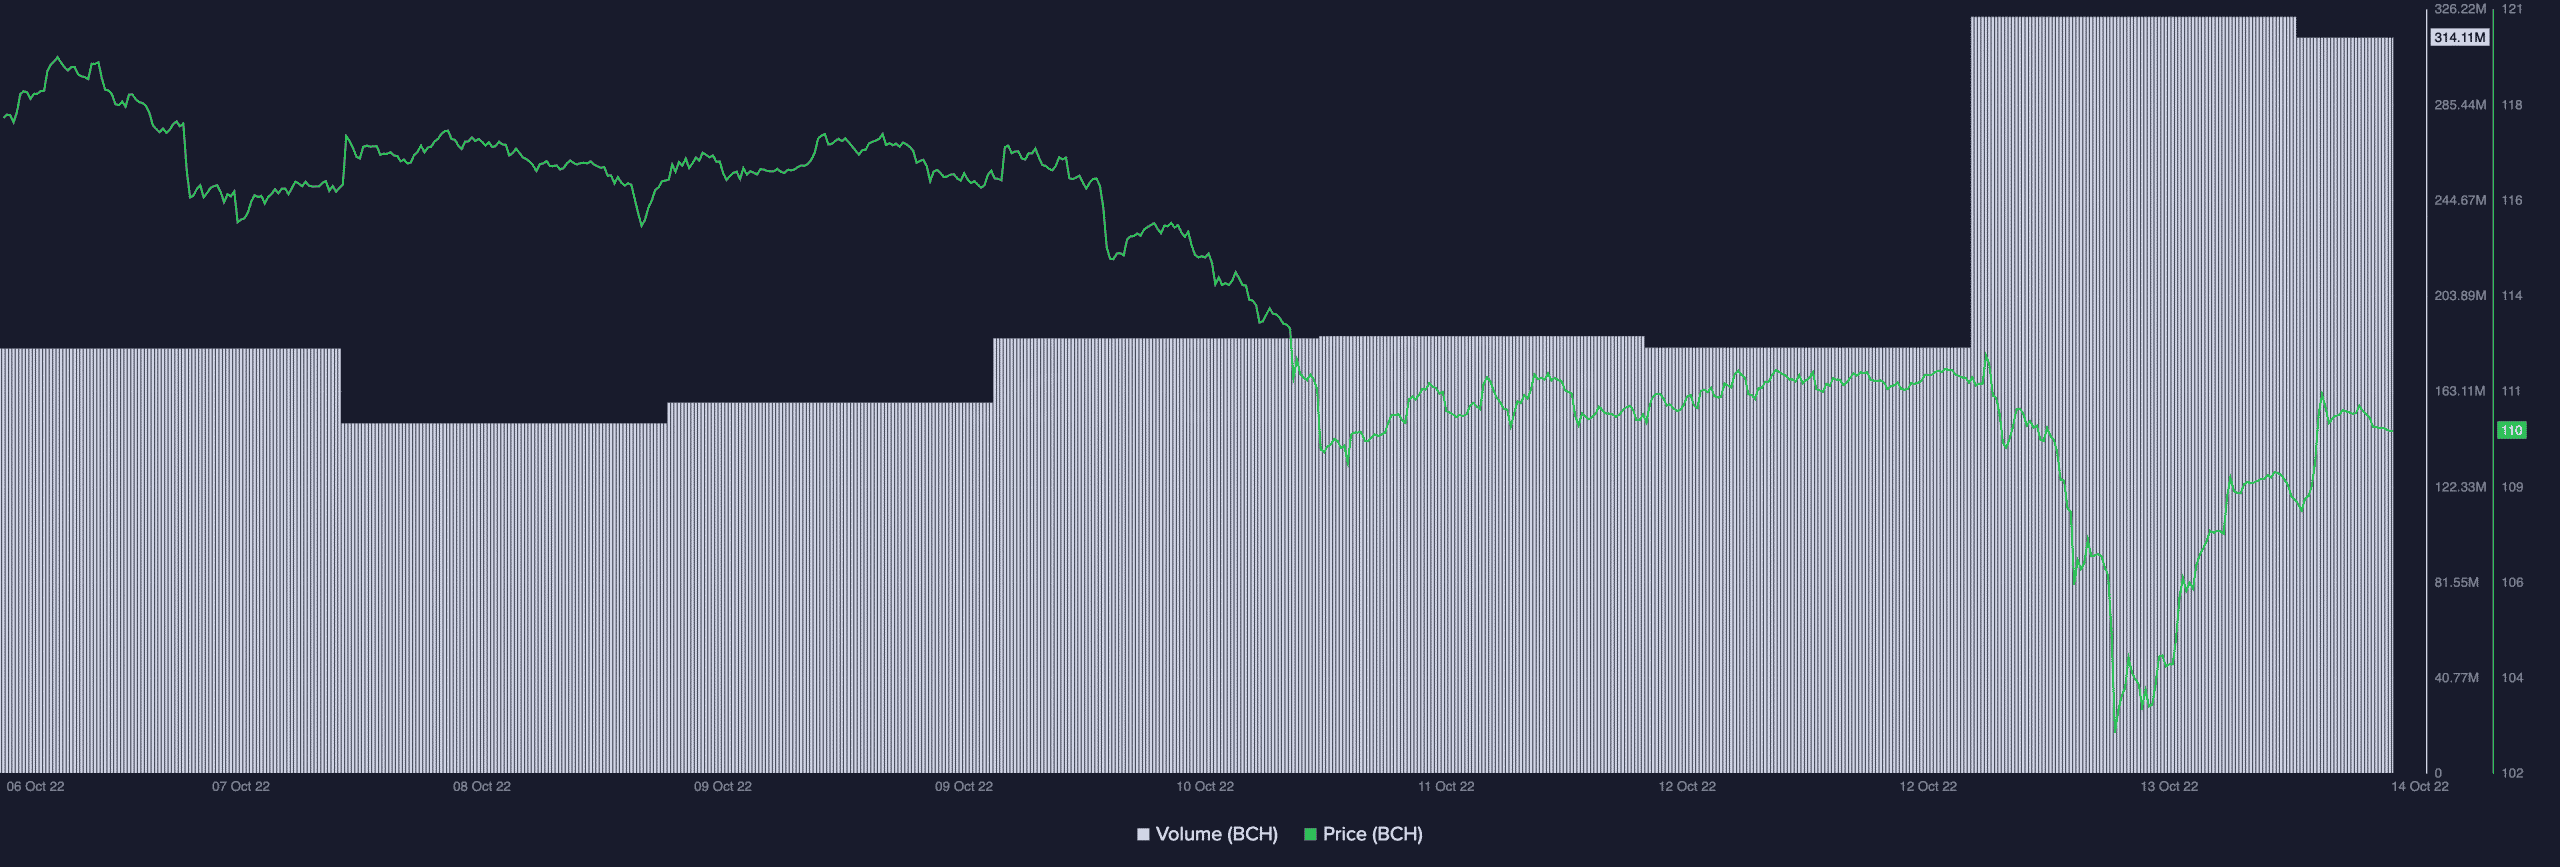
Source: Santiment
Sellers “cashing” out
With the last seven days marked by a decline in BCH’s price, buying pressure dropped in the last week on a daily chart. As a result, on 5 October, the asset’s Relative Strength Index (RSI) and Money Flow Index (MFI) fell below their respective neutral lines to pursue new lows.
At press time, the MFI inched toward the oversold region at 33.41. Following a similar progression, BCH’s RSI rested at 41.79 at press time.
As sellers gradually overran the BCH market, a new bear cycle was initiated on 10 October. At press time, the Moving average convergence divergence (MACD) was made of red histogram bars with an intersection of the MACD line (blue) with the trend line (red) in a downtrend.
In addition, a look at the asset’s On-balance volume (OBV) confirmed that investors have heavily distributed BCH since 9 September. The indicator has since been on a downtrend, and the price has fallen by 15%.
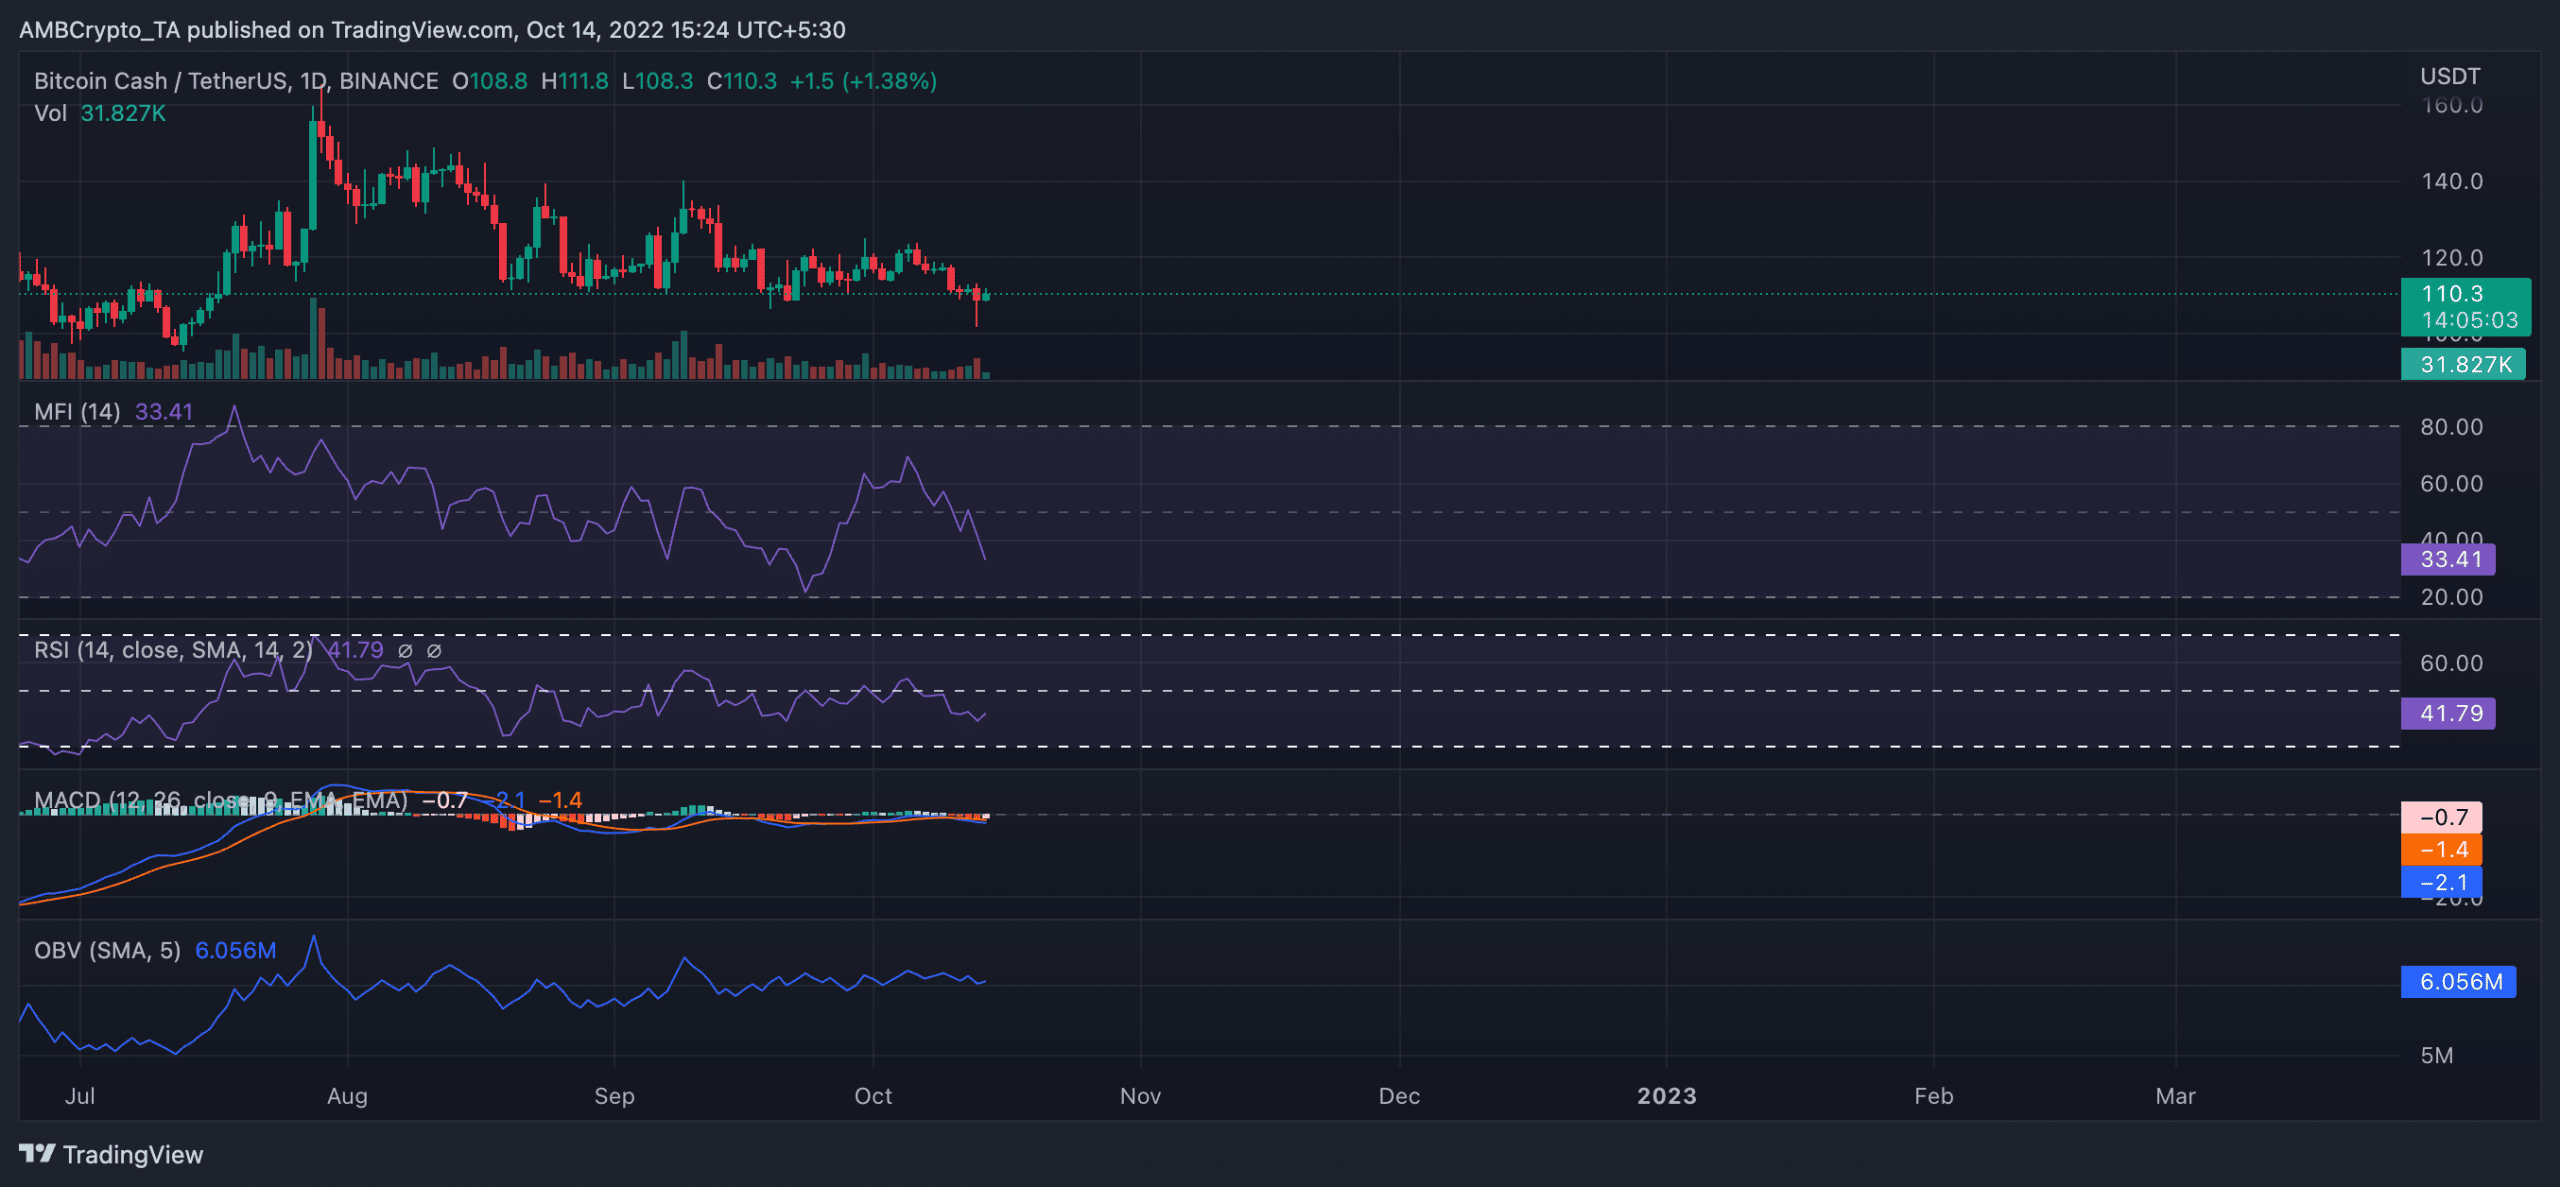
Source: TradingView
Before you write off the Bitcoin fork
While these key indicators have shown a decline in BCH’s accumulation in the last week, a look at the asset’s Chaikin Money Flow (CMF) revealed a divergence with its price.
In the face of its falling price, BCH’s CMF rested above the center line to post a positive value of 0.08. This typically represents a surge in buying pressure which usually precipitates a rally in the price of an asset.
However, as in the current market, a CMF/price divergence occurs when the price of a crypto asset trades at the oversold zone while its CMF continues to rise. This is usually taken as a buy signal, so traders looking to move against the market need to take note of this.

Source: TradingView
Leave a Reply