

Avalanche Bulls Faces Resistance Near $20.45; Is $24.00 Next In Offer?

Published 4 hours ago
Avalanche bulls taking charge of the price on Friday. The price extends the gains for the third straight day. However, AVAX still hovers in a short-term range of $18.30 and $20.45. Additional buying participation is required to sustain the gains.
- AVAX’s price looks optimistic as its prints gain above 4%.
- Above $20.45 closing on the daily basis seeks 20% further upside.
- The price depreciated nearly 35% from the swing high of $30.86.
Avalanche price is about to extend gains further
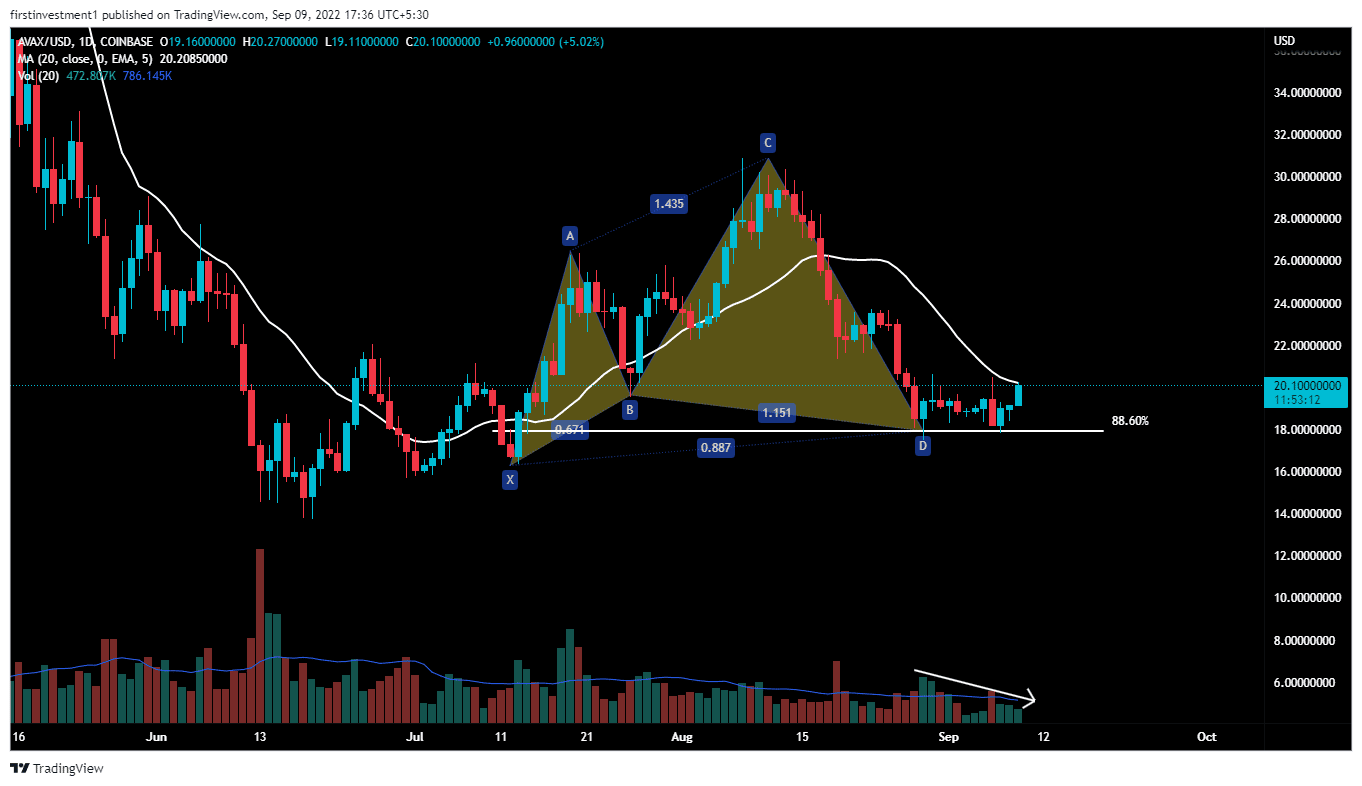
Avalanche on the daily chart formed a “Bullish Shark” harmonic pattern. In a bullish Shark pattern, however, the second top is higher than the first. In addition, it combines Fibonacci with Elliott’s waves theory, and some new ratios like 88.6% are used. Along with this bullish pattern. Price hasn’t broken its previous swing low as well, indicating a possible reversal in the coming future.
According to this pattern, If the price closes above the high of a strong bearish candle, test the 88.6% Fib. level ($20.60), then we can expect a bullish movement of up to ($23.60).
The price is facing another resistance at the same given level of the 20-day exponing moving average, which lies at the highs of the consolidation zone. A good breakout above that level, with good volumes, will help AVAX to make a bullish turnaround in the near future.
The price even formed a Double Bottom structure on the daily chart, The pattern’s neckline also stands at the same given level. So, to understand it clearly, daily candle closing above 21, will change the direction from bearish to bullish.
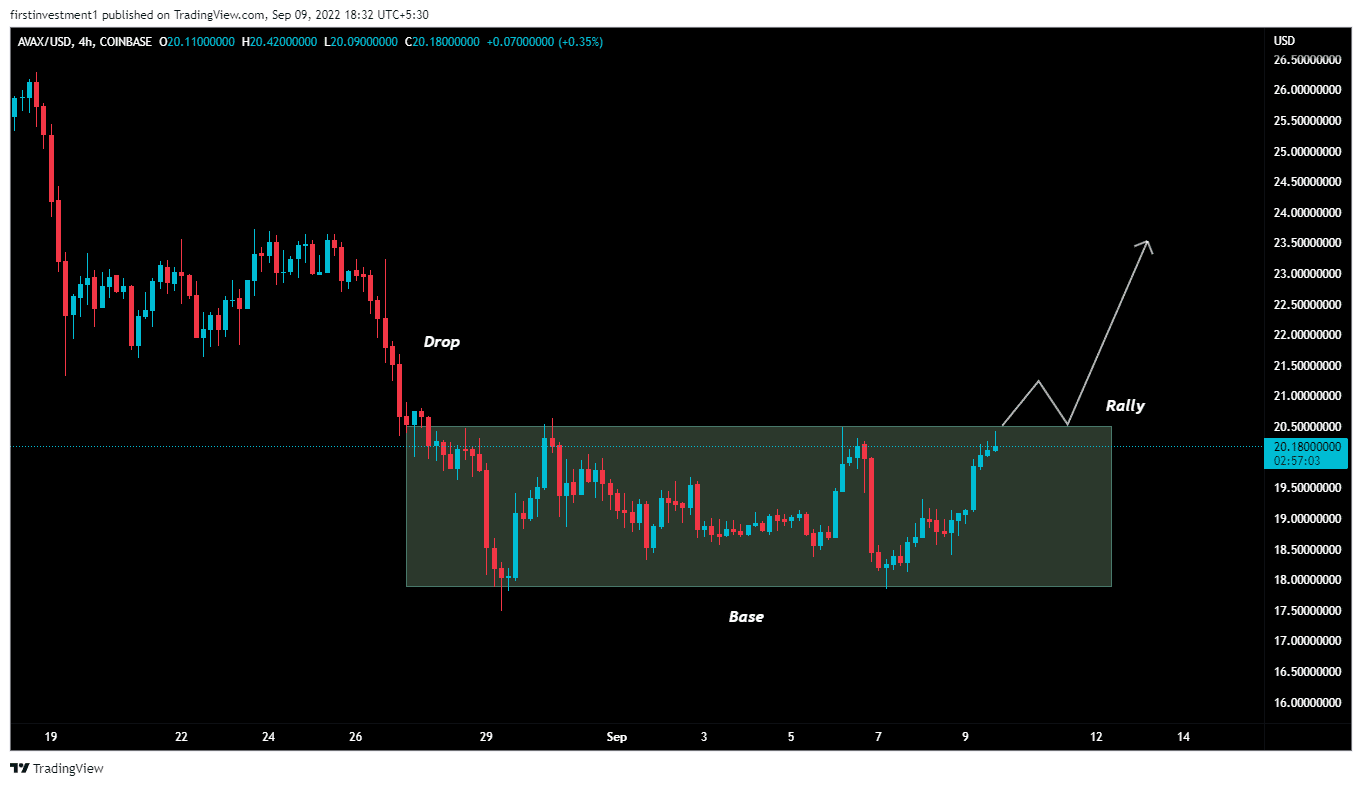
On the four-hour chart, after falling sharply from $23.65 to $17.50 with more than 25% fall, went into a consolidation zone, which means creating a base near the lower levels, implying accumulation near support.
The big market player is slowly entering a long trade while exiting short positions. If the price closes above this range, then we can expect a price to go up to its previous swing high, which is $23.65.
The price on the same chart is even in the formation of a “Drop-Base-Rally” pattern. DBR pattern creates a zone that shows the demand to retail traders on the chart. The demand zone means more buyers want to buy from that zone. Because the market always moves from one zone to another zone in technical analysis.
Also read: Classic Could Realistically Rally To This Level Before Merge?
The nearest support is ($18.38), whereas the most relative resistance is around ($21).
On the other hand, a break below the $18.30 level could invalidate the bullish outlook. And the price could drop below $17.50.
The presented content may include the personal opinion of the author and is subject to market condition. Do your market research before investing in cryptocurrencies. The author or the publication does not hold any responsibility for your personal financial loss.
Close Story
Leave a Reply