

Avalanche [AVAX] bulls can steer through this bearish breakout
The liquidations from Avalanche’s [AVAX] previous symmetrical triangle pulled the alt below its eight-month trendline support (previous resistance).
But the market-wide growth aided the bulls in fixating a position above the $21-level. Besides, the recent patterned breakdown could slow down the near-term bullish momentum.
Should the buyers be adamant about defending the$21-level, AVAX could see a low volatility phase before any revival chances. At press time, AVAX traded at $22.47, down by nearly 14% in the last 24 hours.
AVAX Daily Chart
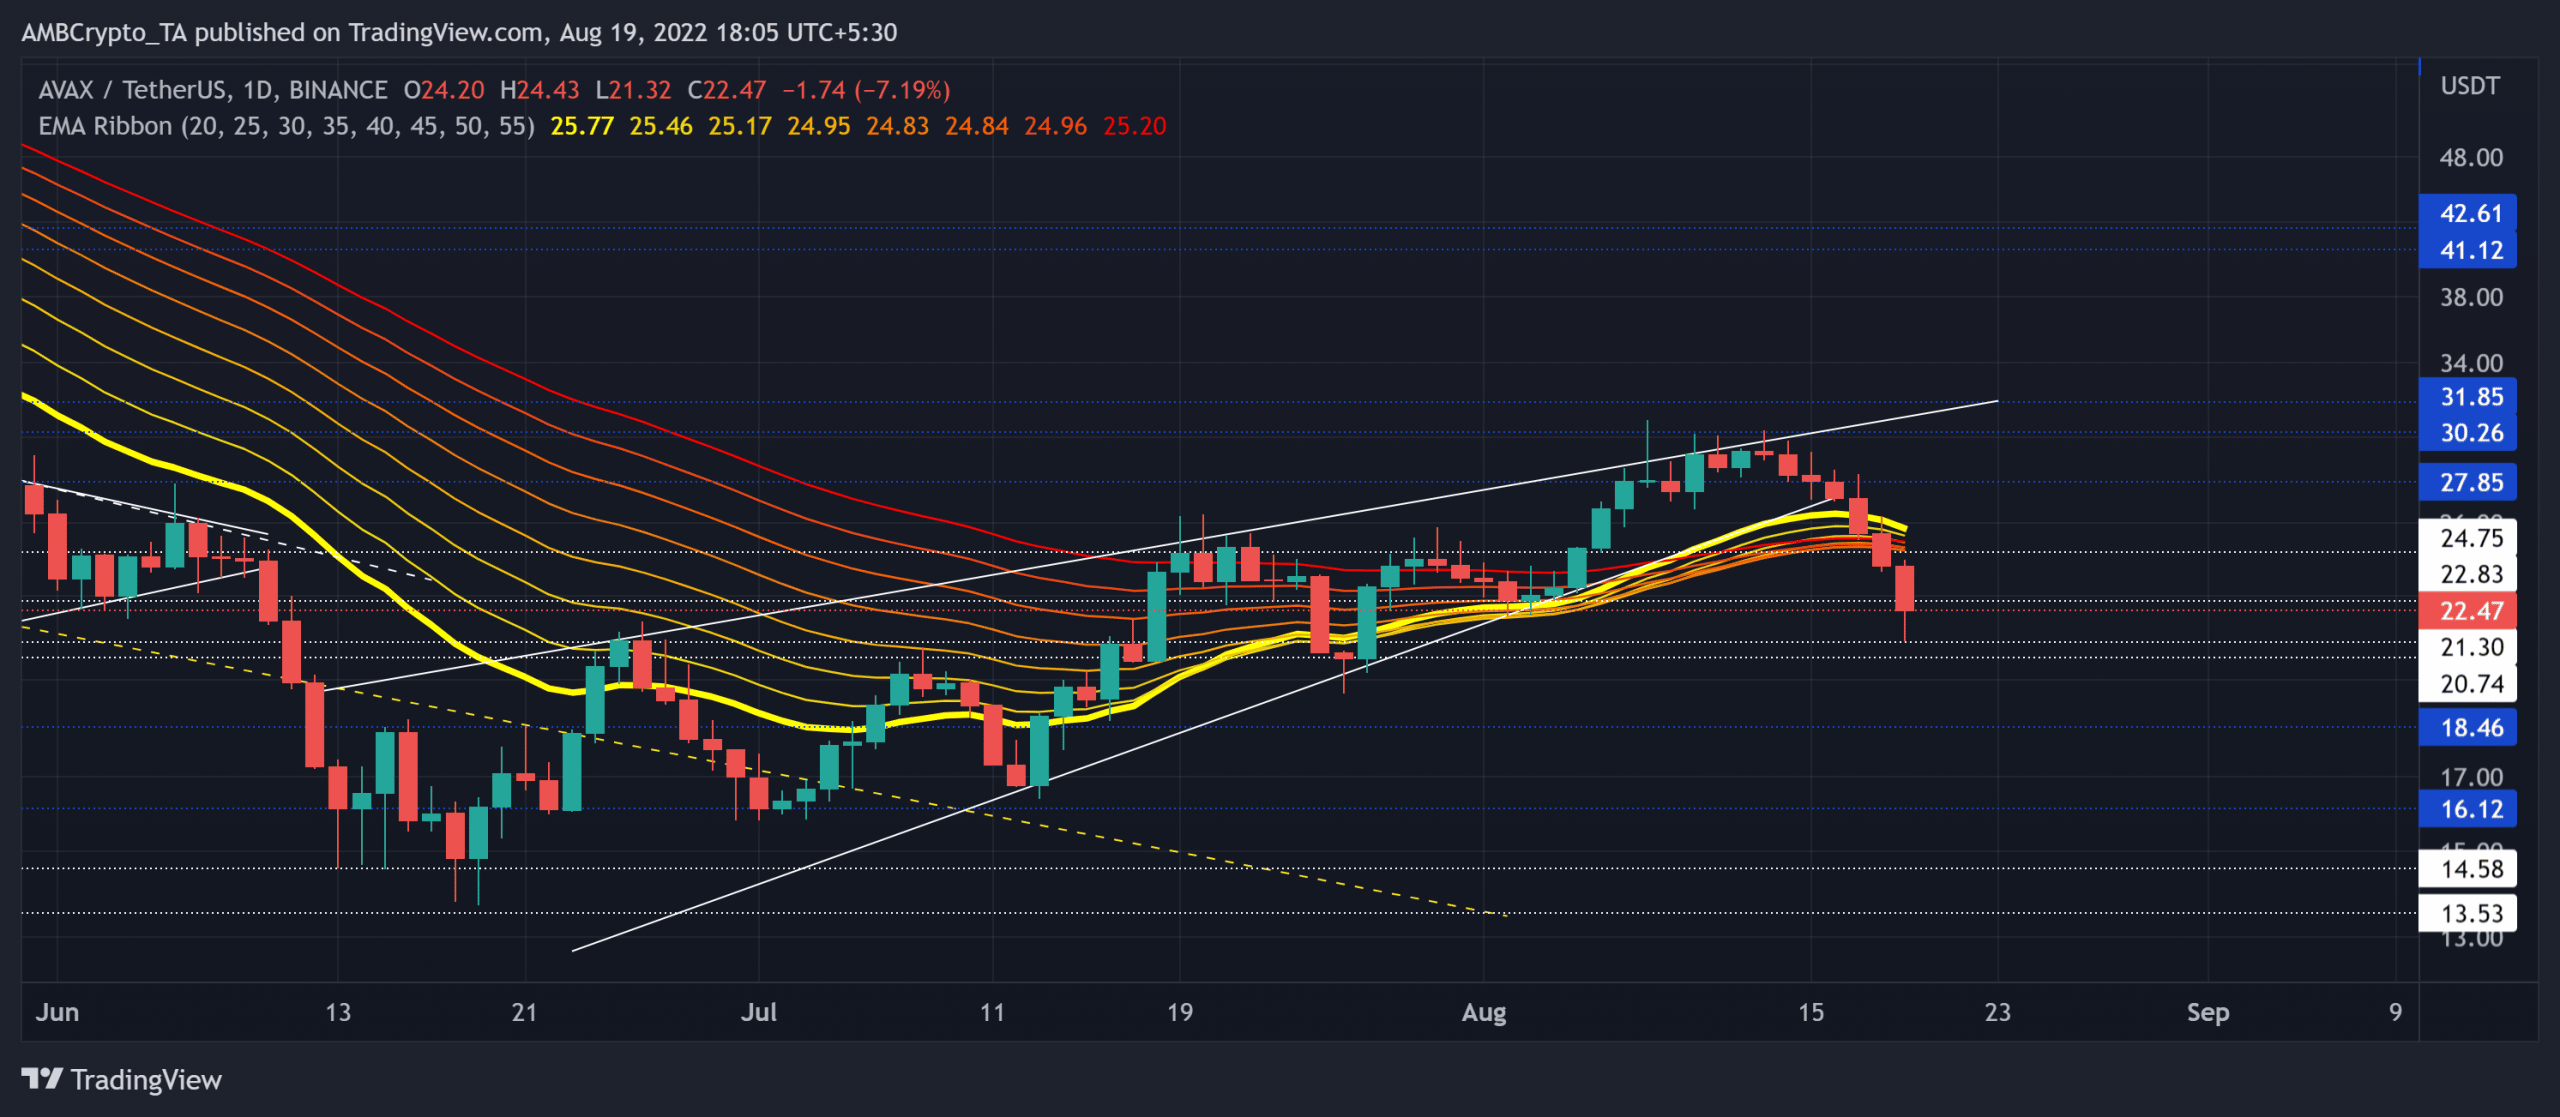
Source: TradingView, AVAX/USDT
AVAX lost more than 90% of its value since its ATH and plunged toward its ten-month low on 19 June. Then, the bulls were quick to reclaim a spot above the trendline support (yellow, dashed). This comeback saw reversal tendencies from the $30-$31 range resistance.
The recent rising wedge breakdown inflicted an uptick in selling volumes while AVAX plunged below its EMA ribbons.
With the price action approaching the $20-$21 support range, the buyers would aim to look for rebounding opportunities.
Here, the potential targets could lie in the $24-zone. However, an inability of the buyers to step in would encourage the ongoing dullness.
In which case, AVAX could enter into a squeeze phase in the coming times.
A compelling close below the $20-support would open up shorting opportunities bearing the target in the $16-$18 range. The traders must carefully assess the implications of the macroeconomic factors on the market sentiment.
Rationale
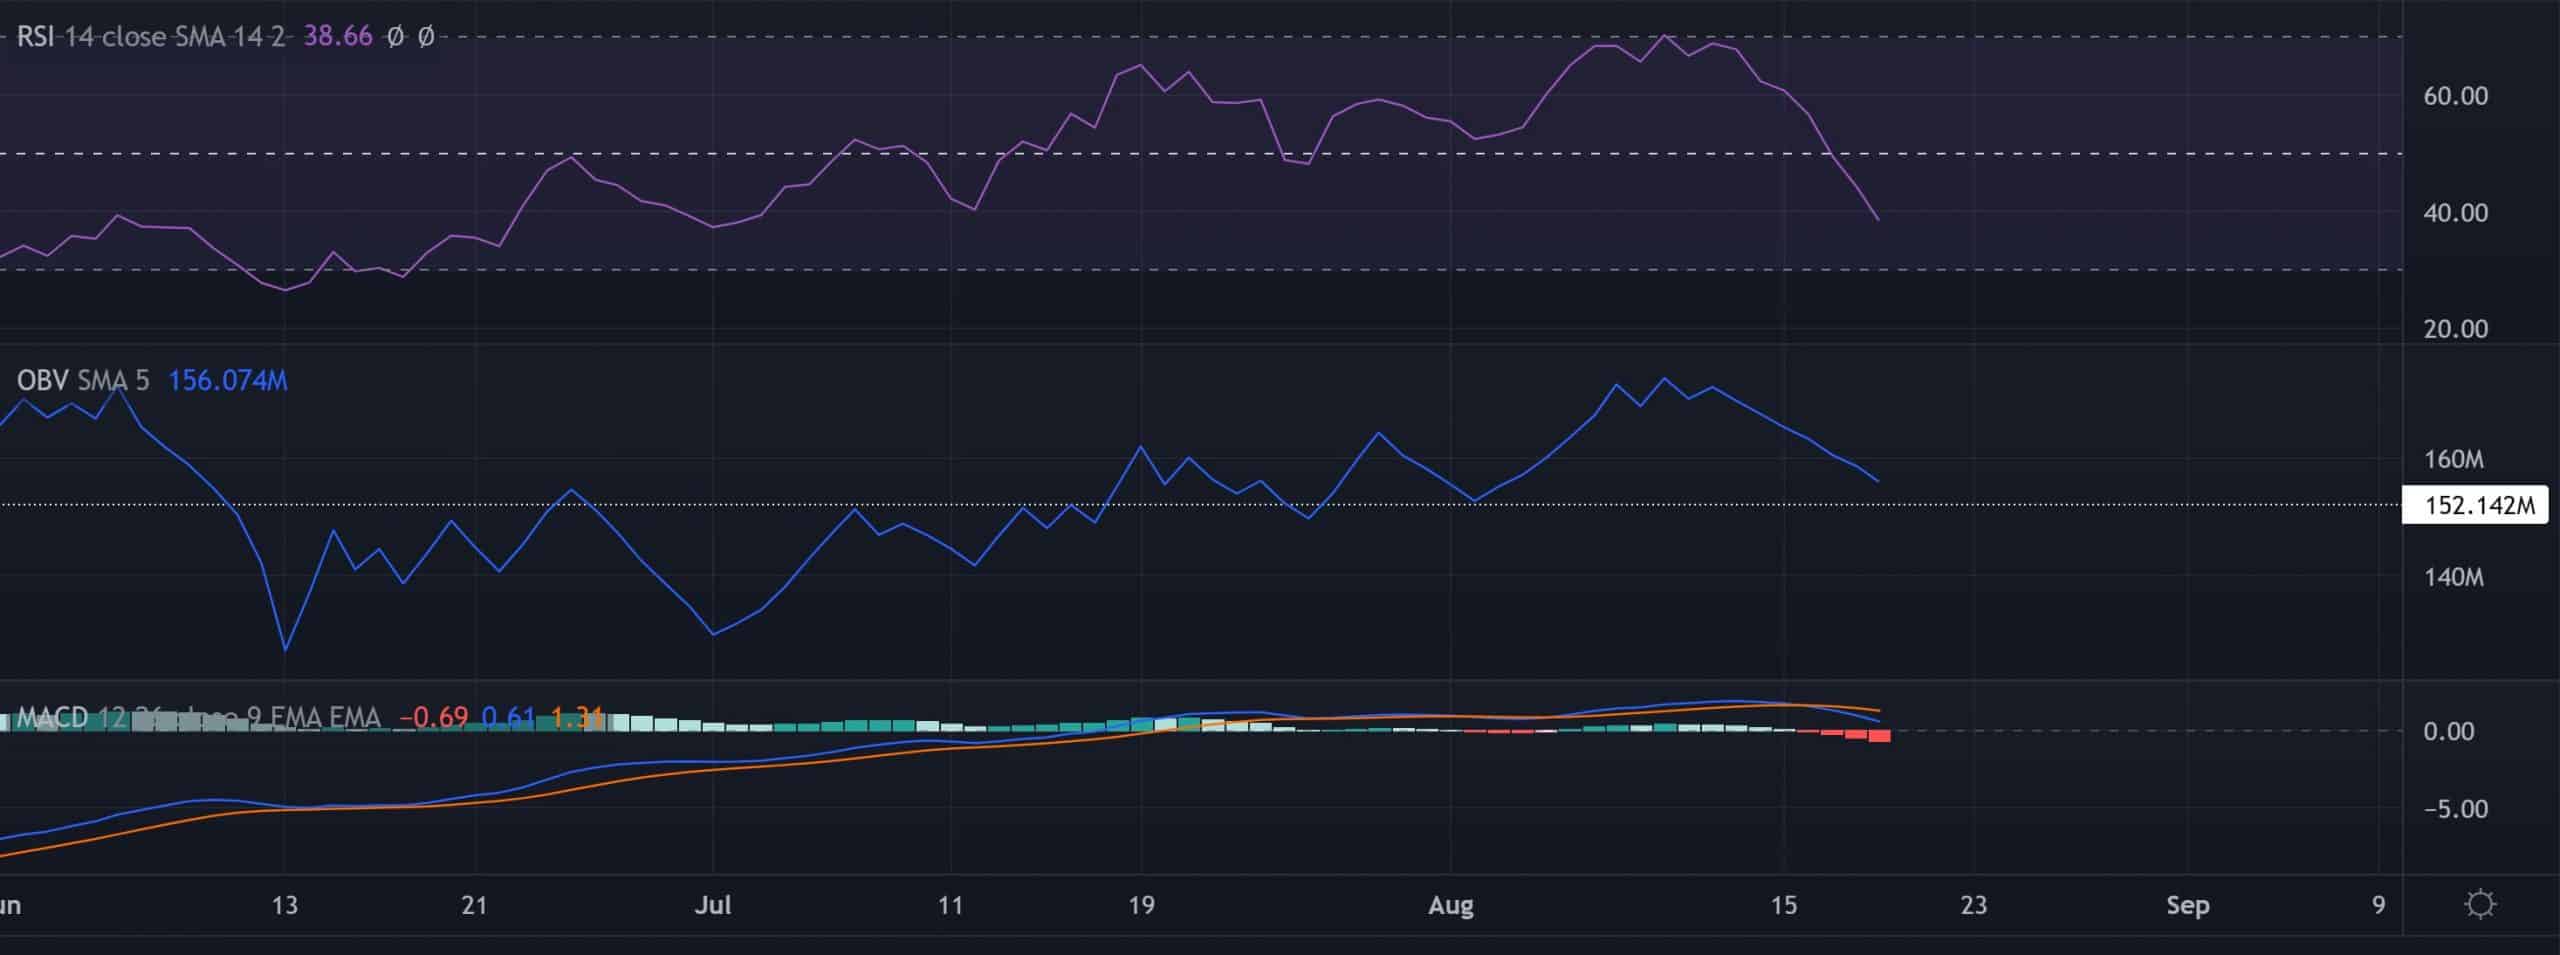
Source: TradingView, AVAX/USDT
After snapping the midline support, the RSI fell in the bearish region and eyed to enter the oversold region. The bulls still had a long way to turn the tides to their fancy.
While the OBV seemingly maintained its support level, any bounce-backs could provoke a near-term bullish push. The traders must watch out for a rebound before placing calls.
Further, the MACD bearish crossover reaffirmed the bearish strength, but the lines were yet to drop below the midline to depict a one-sided bearish edge.
Conclusion
Owing to the immediate support range in the $20-$21 zone, the buyers would hope for a plausible revival. But a bearish crossover on the EMA ribbons could only provoke sluggishness in the near future. The targets would remain the same as discussed.
Finally, the investors/traders must keep a close watch on Bitcoin’s movement. This reading would be vital to complement these technical factors.
Leave a Reply