Solana (SOL) Price Holds Steady Near $200
Solana (SOL) is trading near $200, with its market capitalization aiming to reclaim the $100 billion mark and a daily trading volume of $4 billion. A recent decline in the number of Solana whales—addresses holding at least 10,000 SOL—adds intrigue to the current market situation.
Decreasing Solana Whale Activity
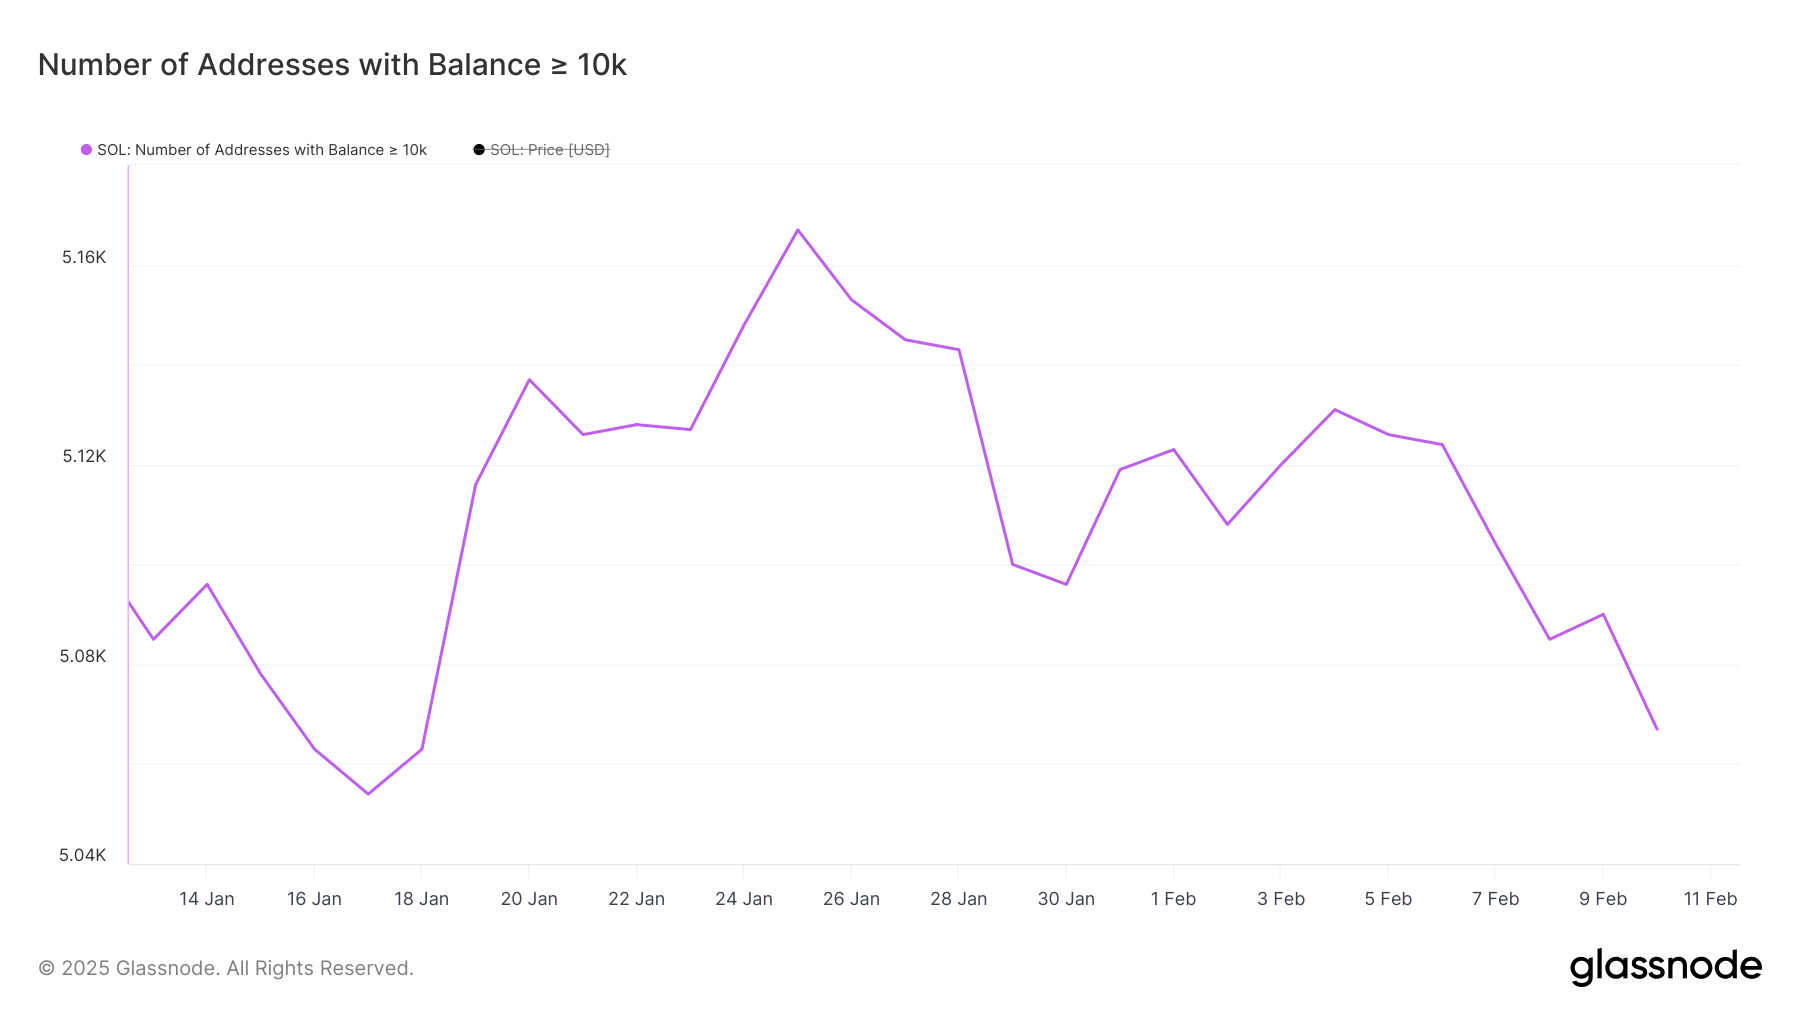
The number of Solana whales reached an all-time high of 5,167 on January 25th. Since then, it has fallen to 5,067, after a brief recovery to 5,131 on February 4th. This decrease in whale activity, coupled with weakening trend strength indicated by the DMI and converging EMA lines, suggests a critical juncture for SOL, with both bullish and bearish possibilities.
Whale activity is a key market indicator. Accumulation can signal confidence and potential price increases, while a decline might suggest distribution and increased selling pressure. While the current whale count remains high historically, the recent drop signals potential volatility.
Weakening Trend Strength
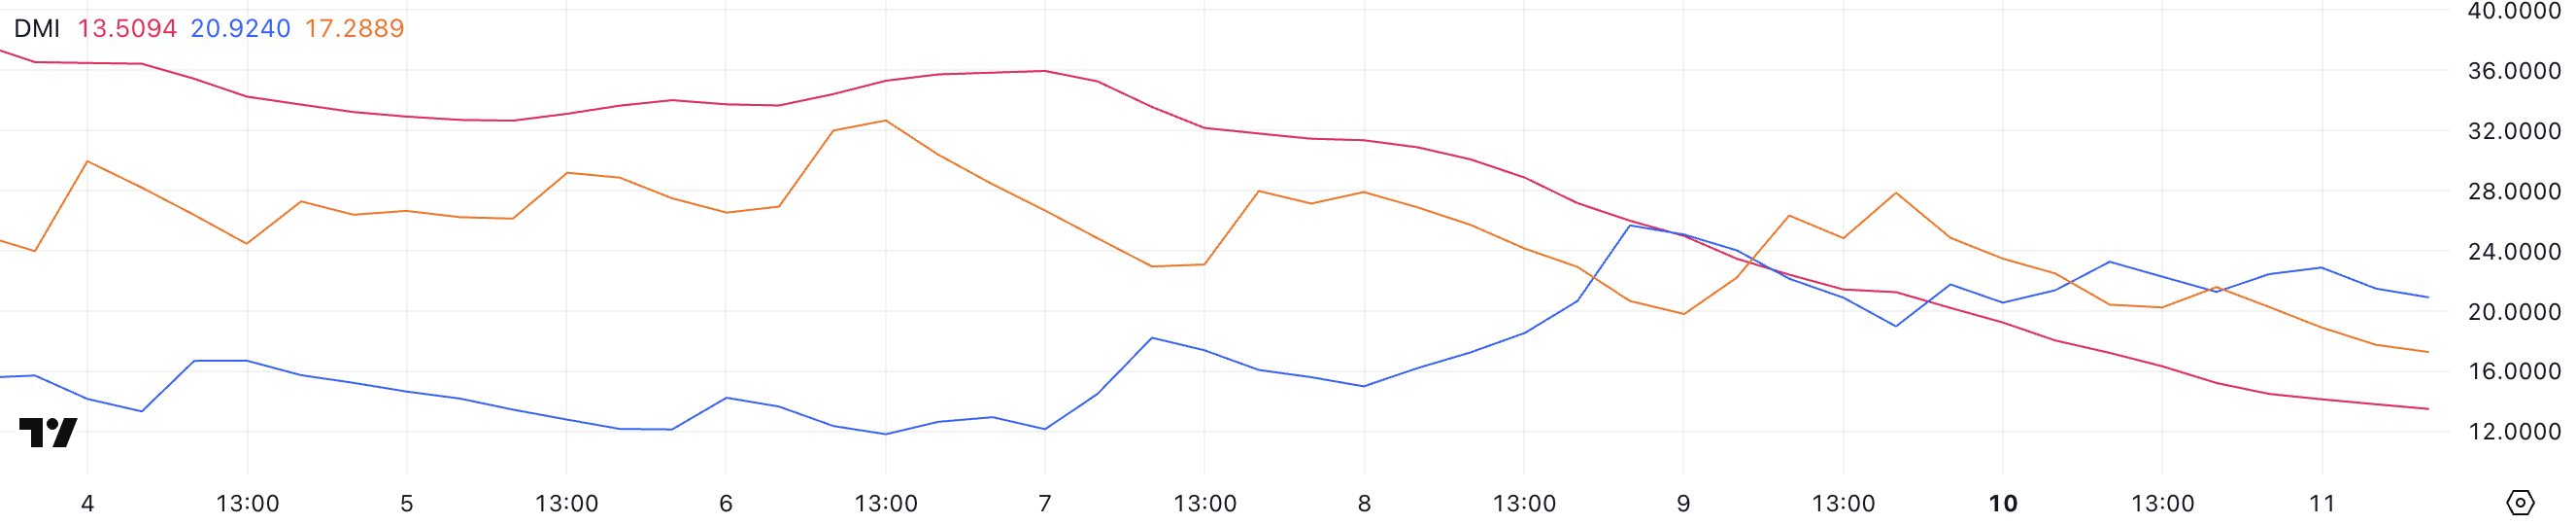
Solana's DMI chart reveals a significant decrease in trend strength. The ADX (Average Directional Index) has dropped to 13.5 from 31.5 in three days, indicating a weak or absent trend momentum. This suggests market consolidation rather than a clear uptrend or downtrend.
The +DI (positive directional indicator) is at 20.9, while the -DI (negative directional indicator) has fallen to 17.2 from 27.8. Bearish pressure has eased, but bullish momentum remains insufficient to establish a clear uptrend. The converging indicators and low ADX suggest a period of sideways trading.
SOL Price Prediction
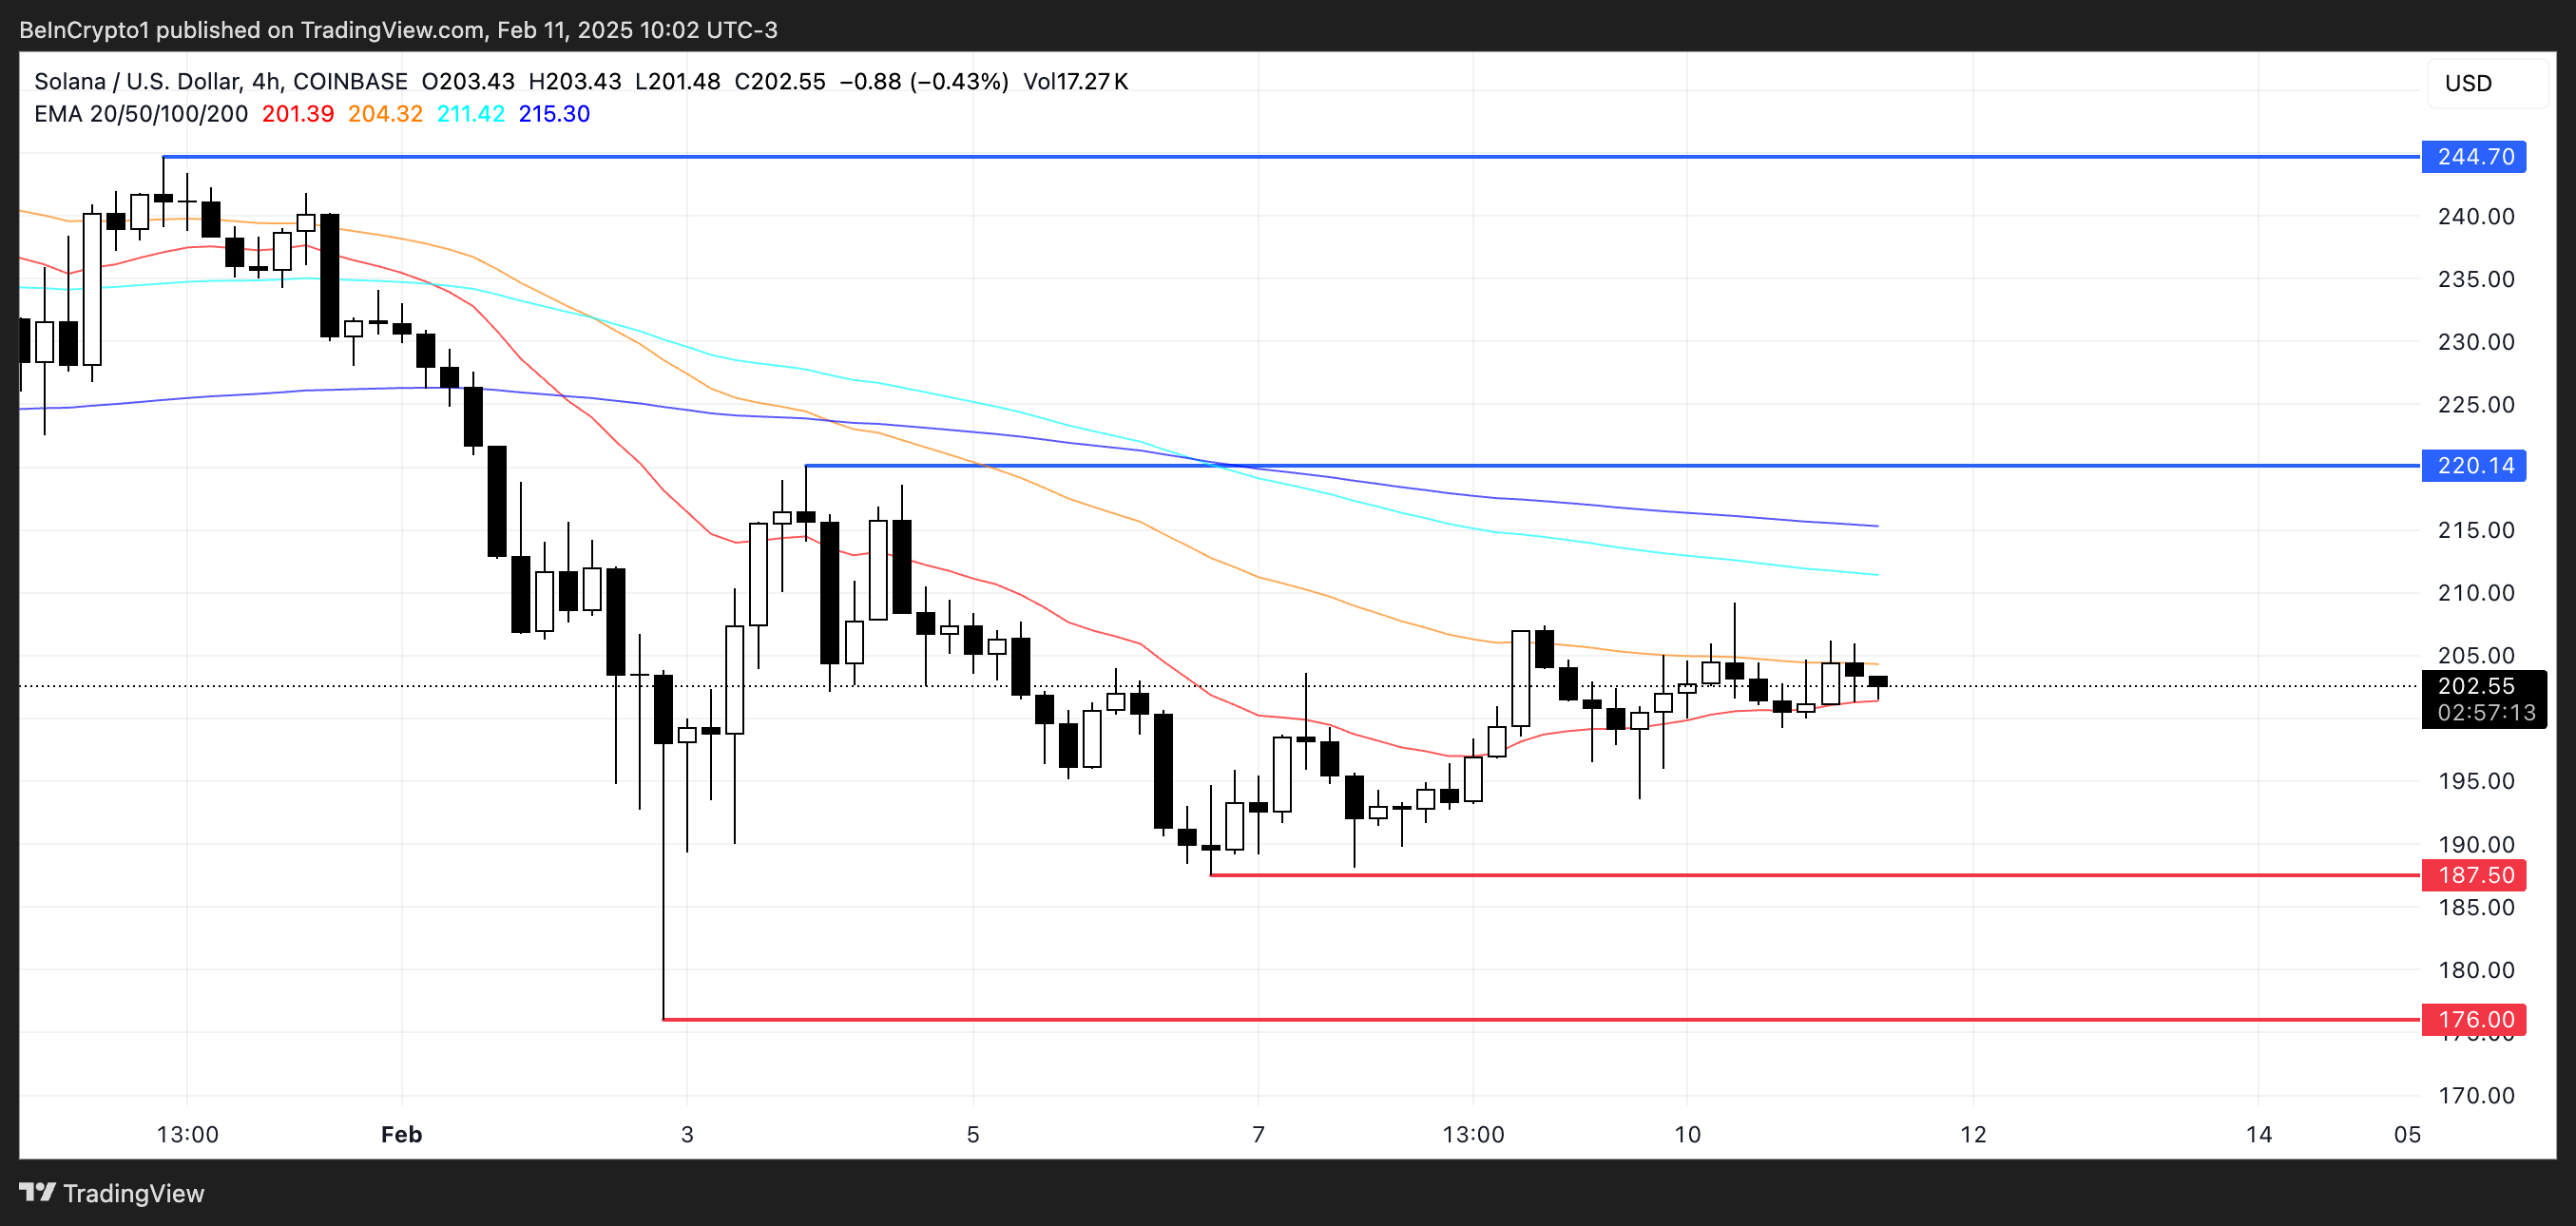
Narrowing EMA lines on the Solana price chart indicate decreasing momentum and an unclear trend direction. A bullish resurgence could lead to a test of the $220 resistance, potentially pushing the price to $244 (its January high). However, a downtrend could retest the key support at $187, potentially dropping to $176 (a 12.5% correction).
Disclaimer: This analysis is for informational purposes only and does not constitute financial advice. Market conditions are volatile. Conduct your own research before making any investment decisions.