Solana's Price Action: Overbought RSI and Shifting Market Dynamics
Solana (SOL) is attempting a recovery after a recent 12% correction over the past week. While its Relative Strength Index (RSI) has spiked into overbought territory (72.91), signaling strong buying pressure, other indicators paint a more nuanced picture. The Bollinger Band Trend (BBTrend) remains deeply negative, although it’s showing signs of easing, suggesting potential market stabilization.
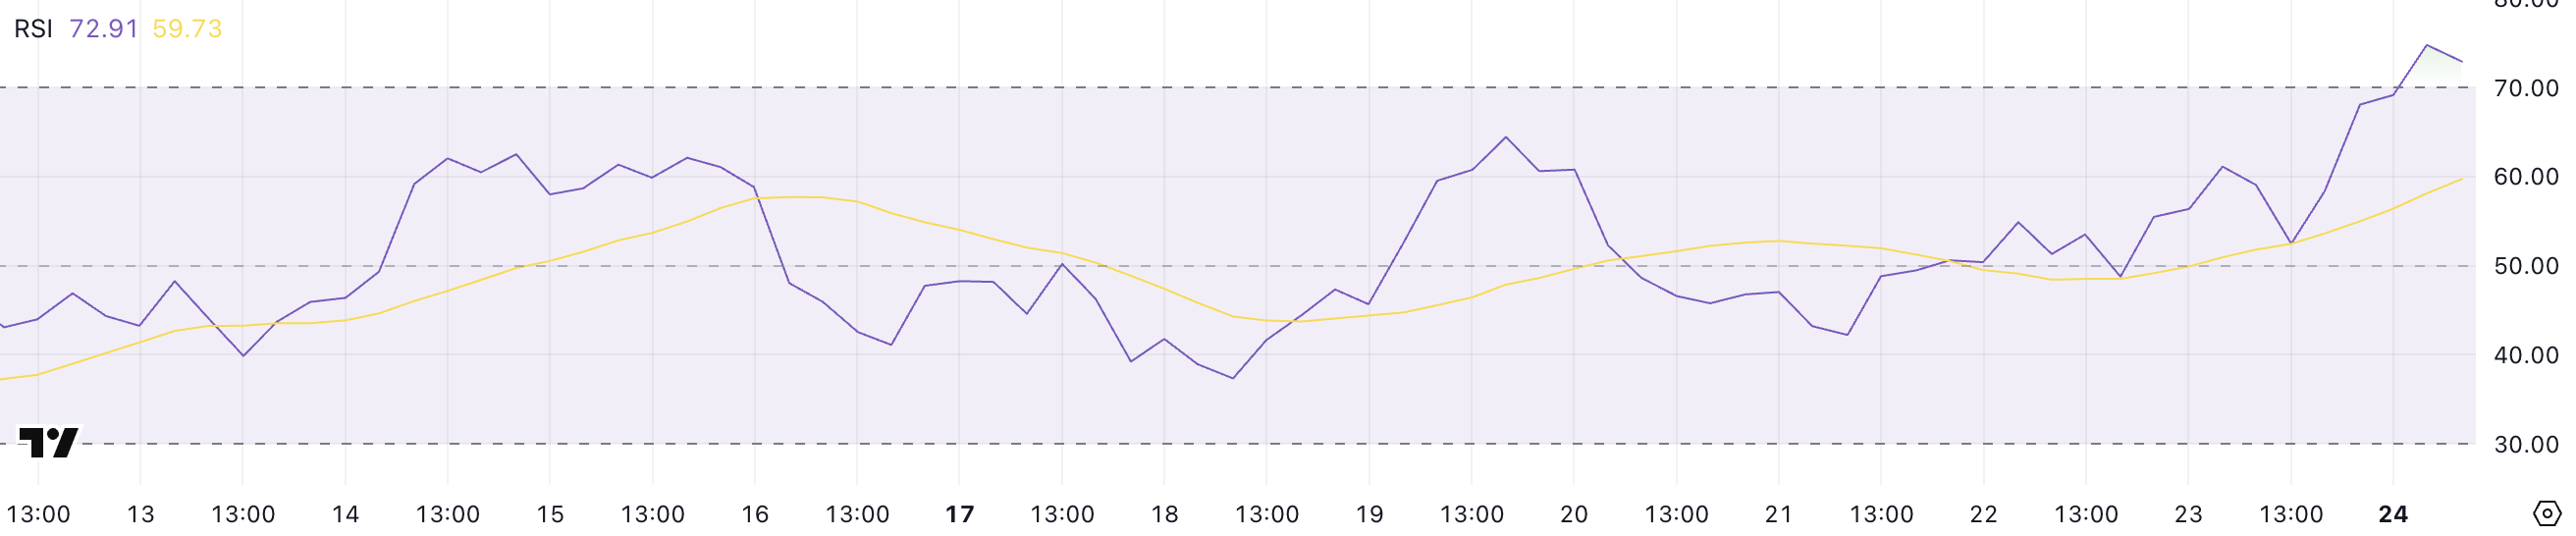
Solana's RSI: Overbought and the Implications
The rapid increase in Solana's RSI from 38.43 to 72.91 in just one day signals a significant shift in short-term momentum. While RSI values above 70 typically suggest an asset is overbought and prone to a pullback, it can also precede a breakout rally. Traders should monitor for confirmation of sustained momentum or signs of exhaustion.
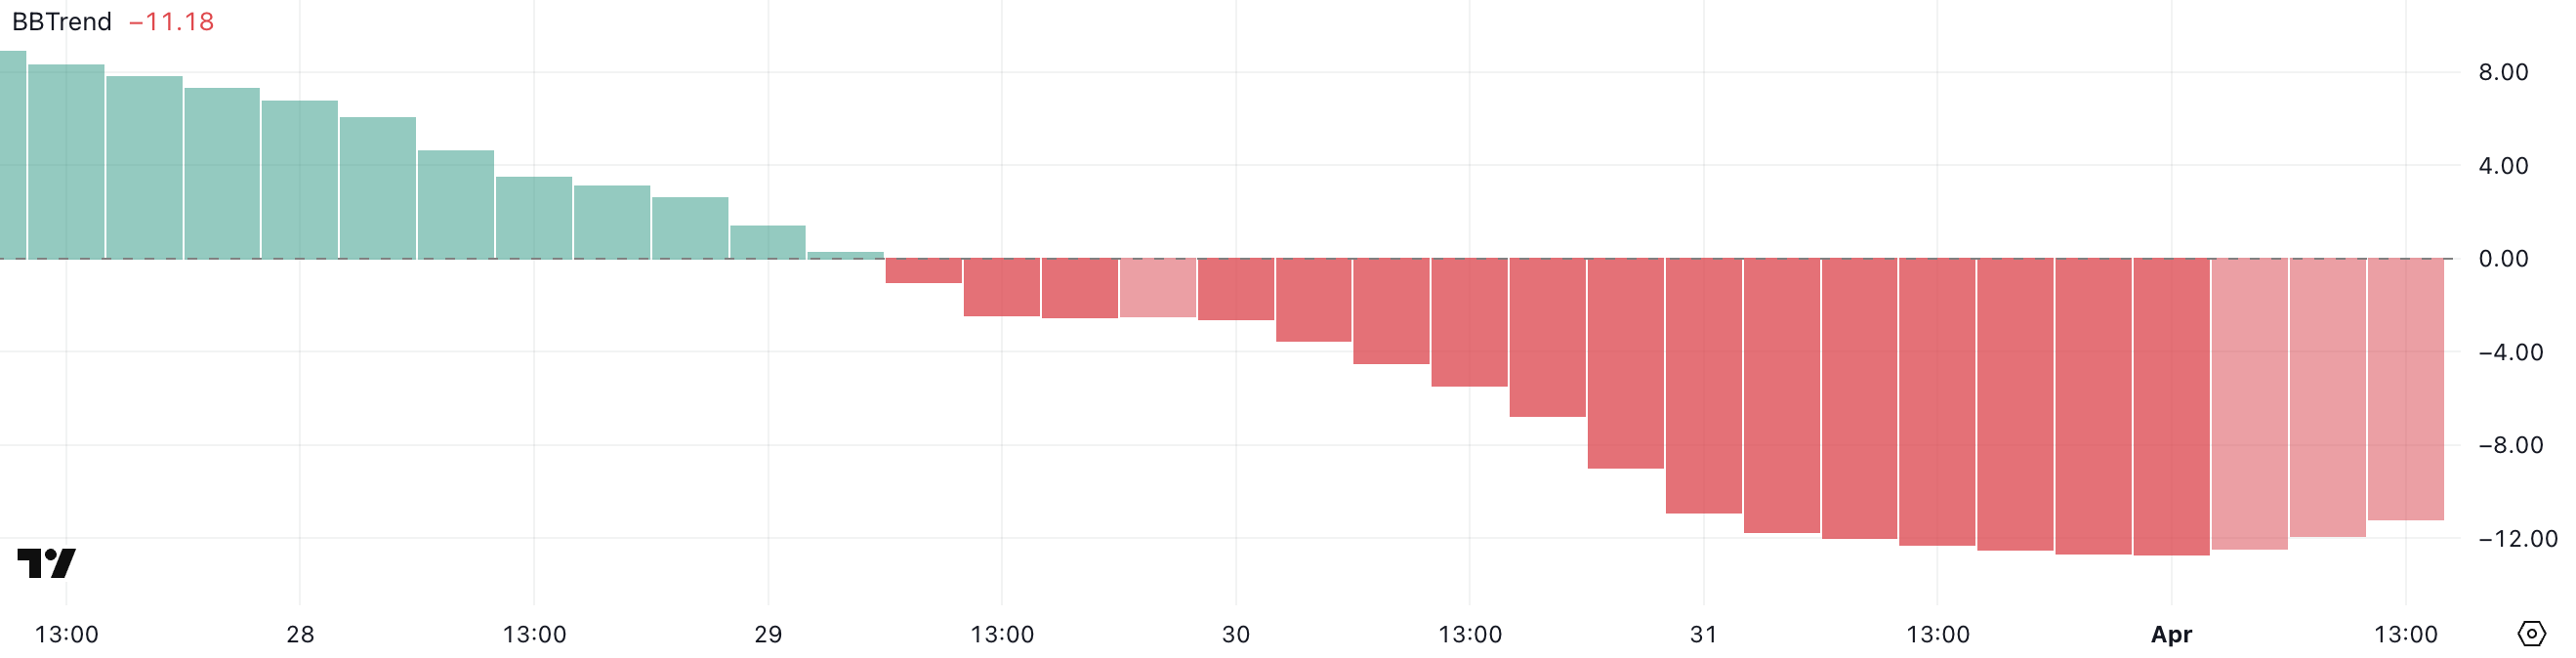
BBTrend Shows Easing Bearish Pressure
Solana's BBTrend indicator, while still negative (-11.18), has improved from its recent low of -12.68. This slight improvement suggests a potential slowdown in the bearish momentum. However, it's crucial to remember that values below -10 generally indicate strong bearish pressure. The improving BBTrend, therefore, offers a glimmer of hope but isn’t a definitive signal of a bullish reversal.
Ethereum's DEX Volume Surge
Adding complexity to the technical analysis, Ethereum recently surpassed Solana in decentralized exchange (DEX) trading volume for the first time in six months. This shift in market dominance highlights the competitive landscape and warrants careful consideration.
Solana's Price Outlook: Golden Cross and Key Support Levels
Solana's moving average convergence divergence (MACD) lines are hinting at a potential golden cross, a bullish signal that may indicate a sustained uptrend. A successful breach above the resistance level of $131 could propel SOL toward $136, and potentially even $147.
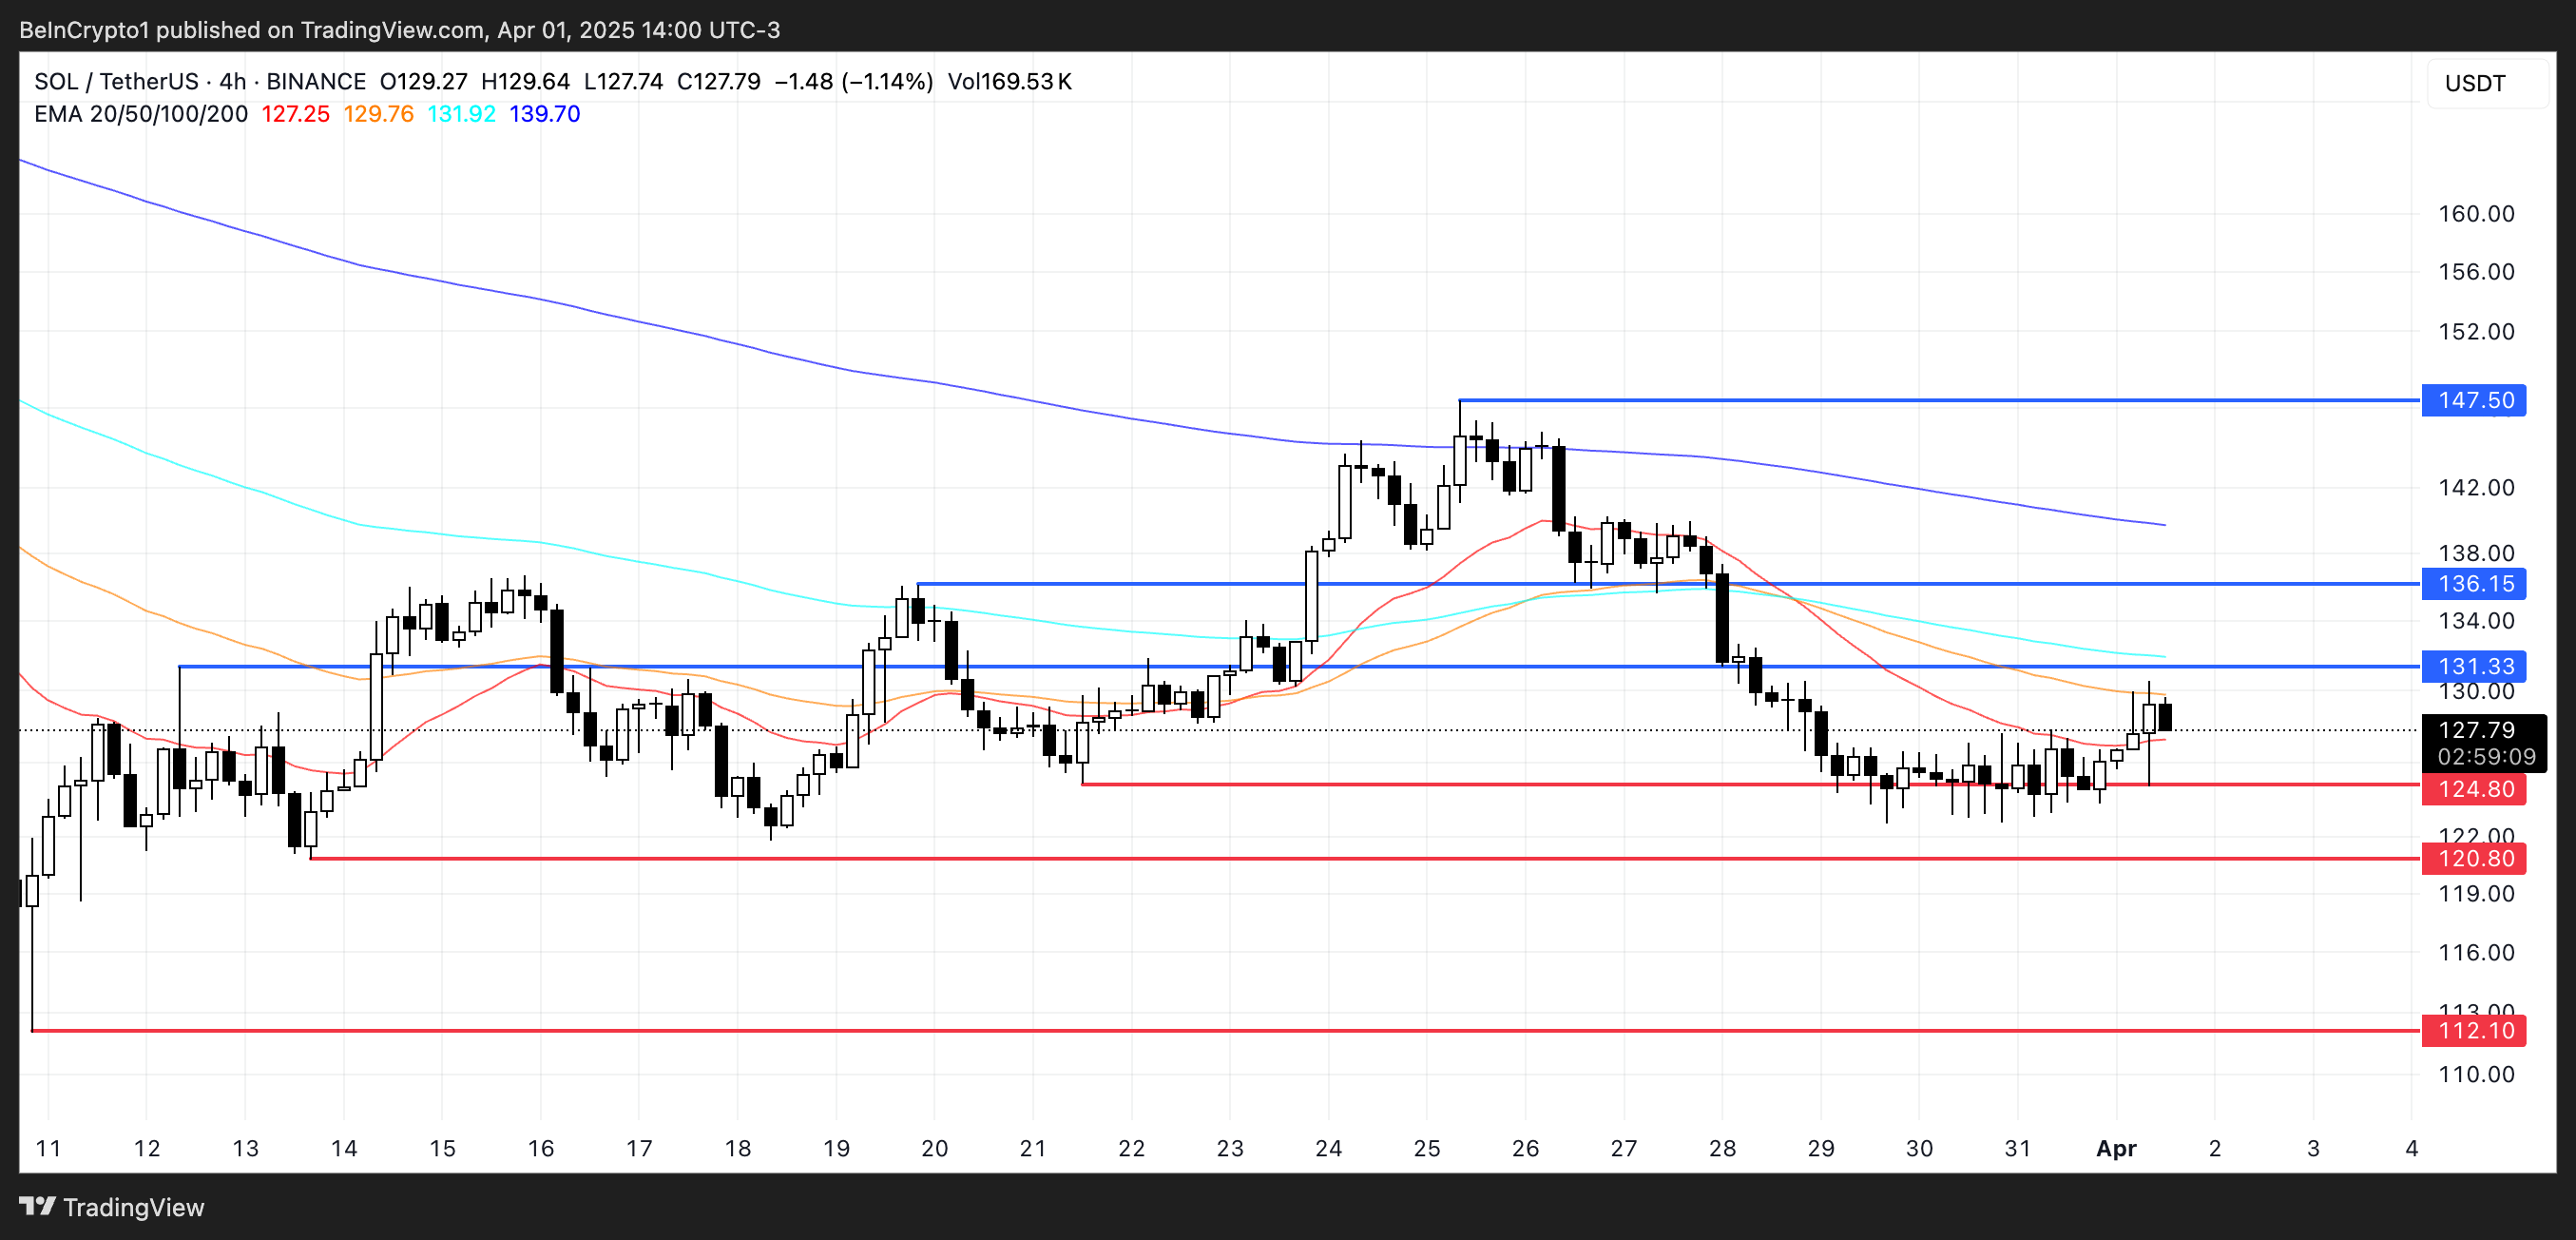
However, failure to maintain recent gains and a drop below the key support level of $124 could trigger further selling pressure, potentially pushing the price down to $120 or even lower towards $112.
Disclaimer: This analysis is for informational purposes only and does not constitute financial advice. Market conditions are volatile; conduct your own research before making any investment decisions.