SOL Price Rebound: Whale Activity & Golden Cross
Solana (SOL) price is attempting a comeback, trading near the $200 mark after dipping below $190. Its market cap is approaching $97 billion, indicating renewed investor interest.
Technical Analysis: Golden Cross and Potential Price Targets
Technical indicators suggest potential for further growth. A golden cross—where a short-term moving average crosses above a long-term moving average—could propel SOL towards $209 and potentially higher. However, if buying pressure weakens, support levels at $187 and $175.8 could be tested.
Whale Activity: A Mixed Signal
The number of SOL whales (wallets holding at least 10,000 SOL) recently declined from 5,131 on February 4th to 5,053 on February 11th, after reaching an all-time high of 5,167 on January 25th. This initial decrease suggested some large holders were selling, potentially creating downward pressure. However, the number of whales has since rebounded slightly to 5,090, indicating a potential shift in sentiment. Continued accumulation by whales could bolster SOL's price; conversely, stagnation or further decline could signal weakness.
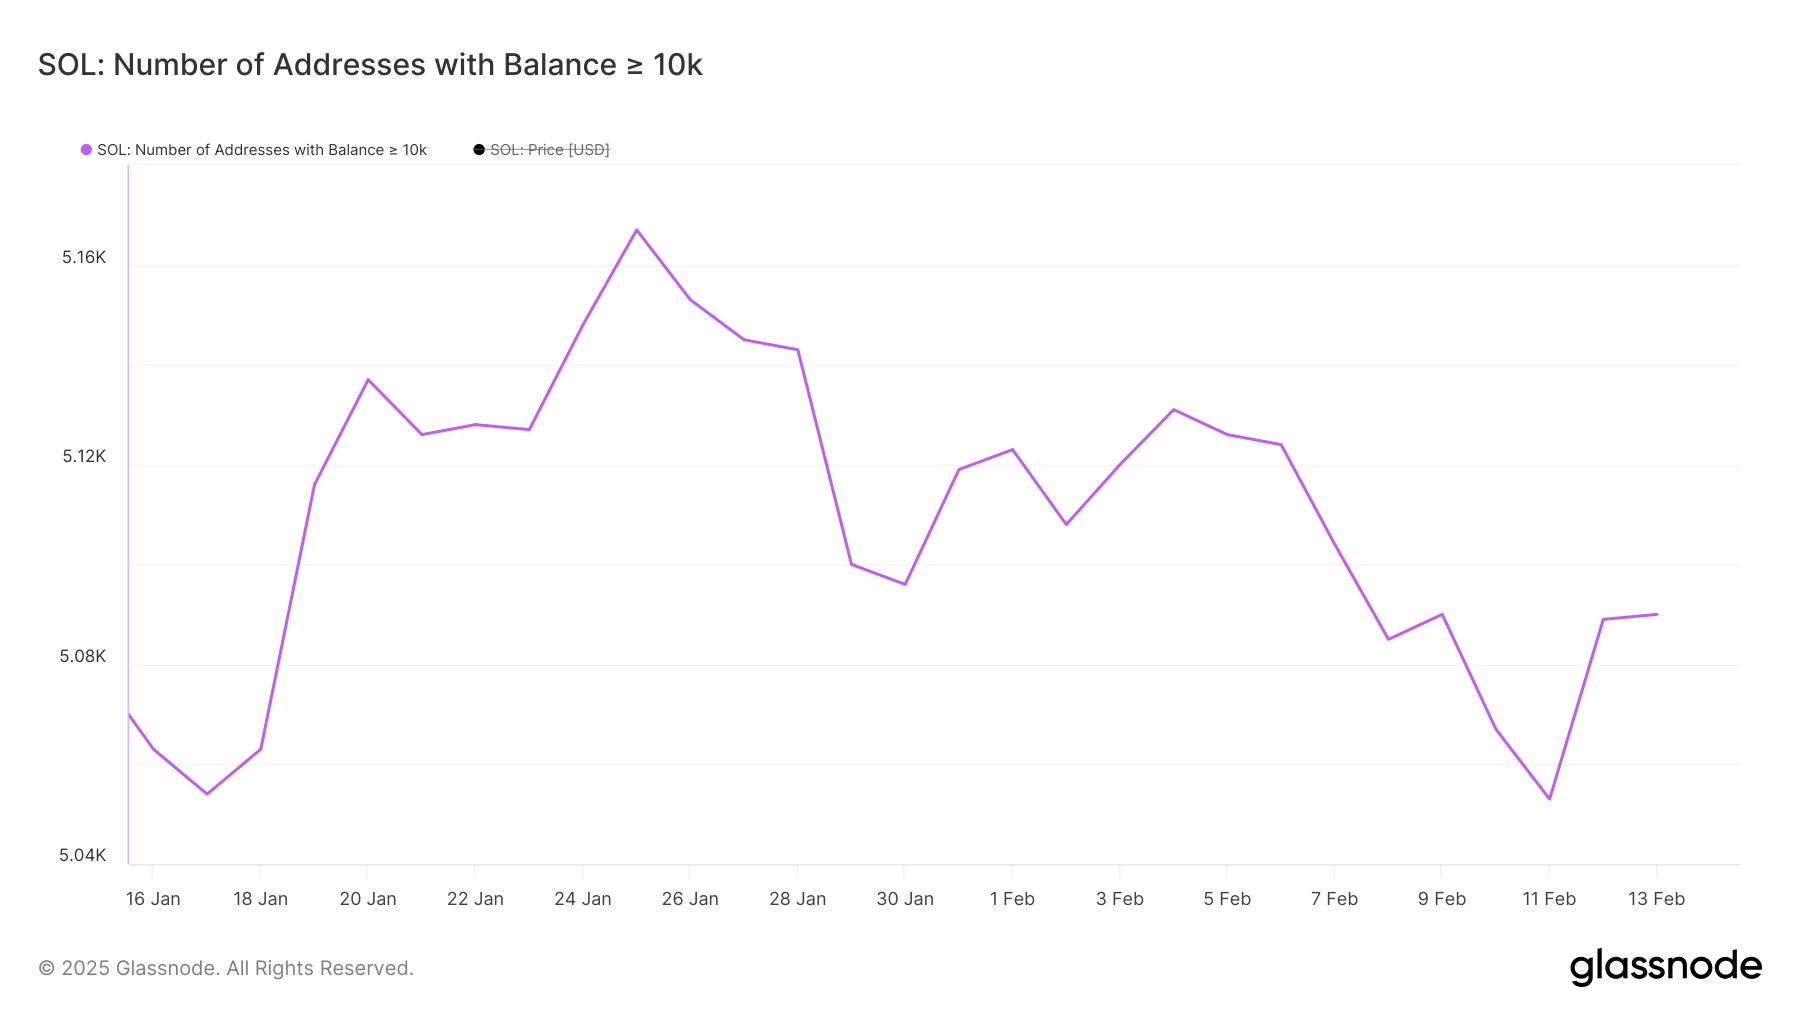
Source: Glassnode
Directional Movement Index (DMI): Shifting Momentum
Solana's DMI shows a weakening trend strength, with the Average Directional Index (ADX) at 18.7 (down from 22.2 the previous day). However, the +DI (positive directional indicator) has risen from 11.3 to 19, while the -DI (negative directional indicator) fell from 26.4 to 19. This suggests a possible shift in momentum towards buying pressure.
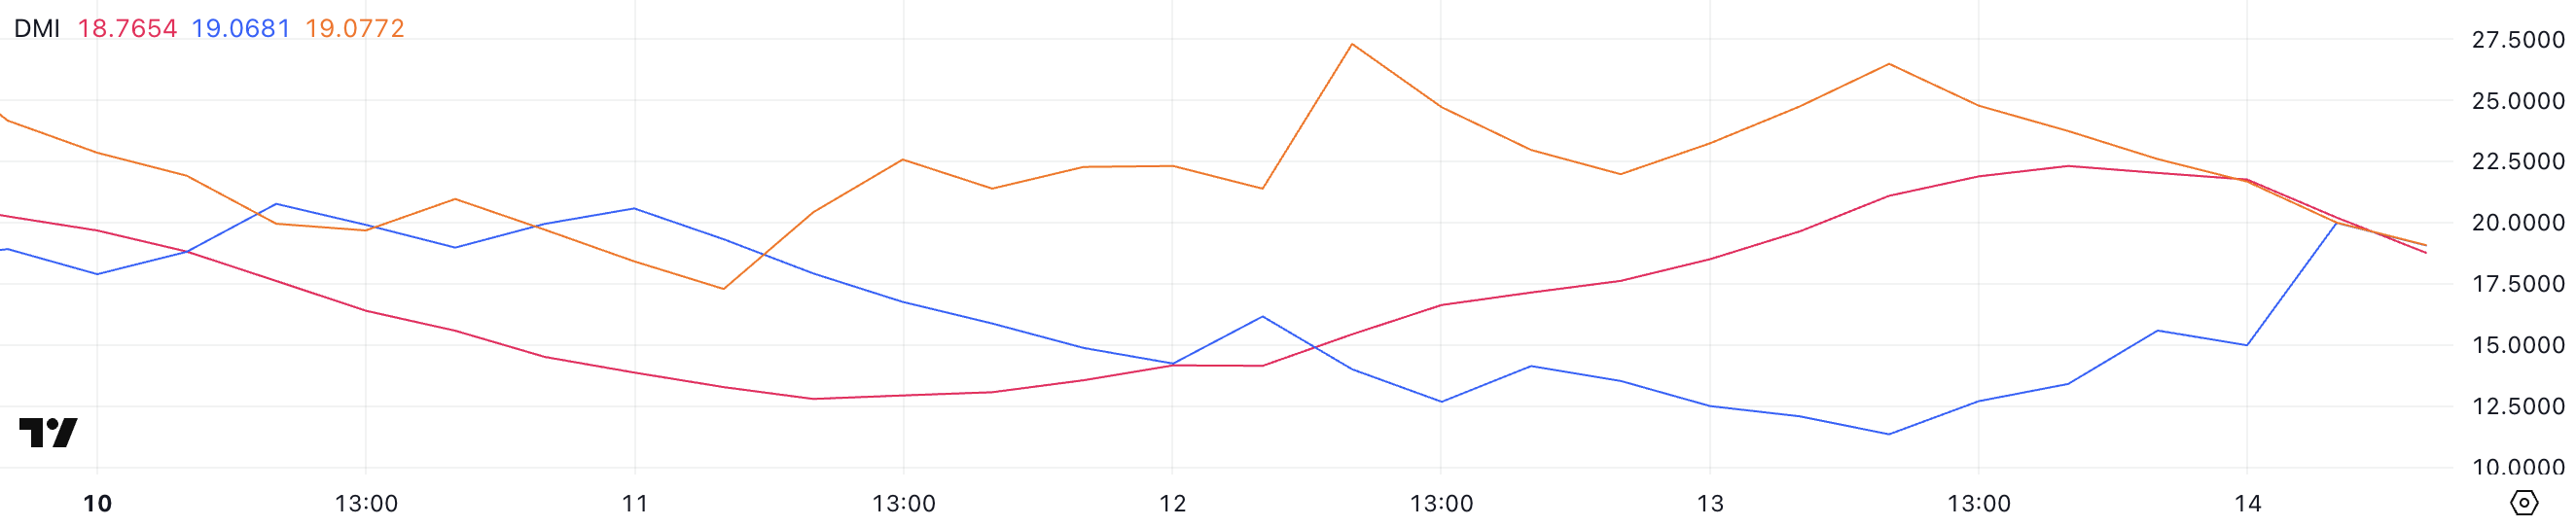
Source: TradingView
An ADX below 20 indicates indecisive market movement. While the DMI shows a potential trend reversal, sustained buying pressure is needed to confirm a new uptrend. Otherwise, consolidation may precede a clearer direction.
SOL Price Prediction: The Road Ahead
The potential for a golden cross and the recent increase in whale activity suggest a possible price rise for SOL. If the golden cross forms and positive momentum continues, SOL could reach $209, and potentially even $244 (its highest level since late January). Conversely, failure to establish an uptrend could lead to a drop to support levels at $187 and potentially $175.8.
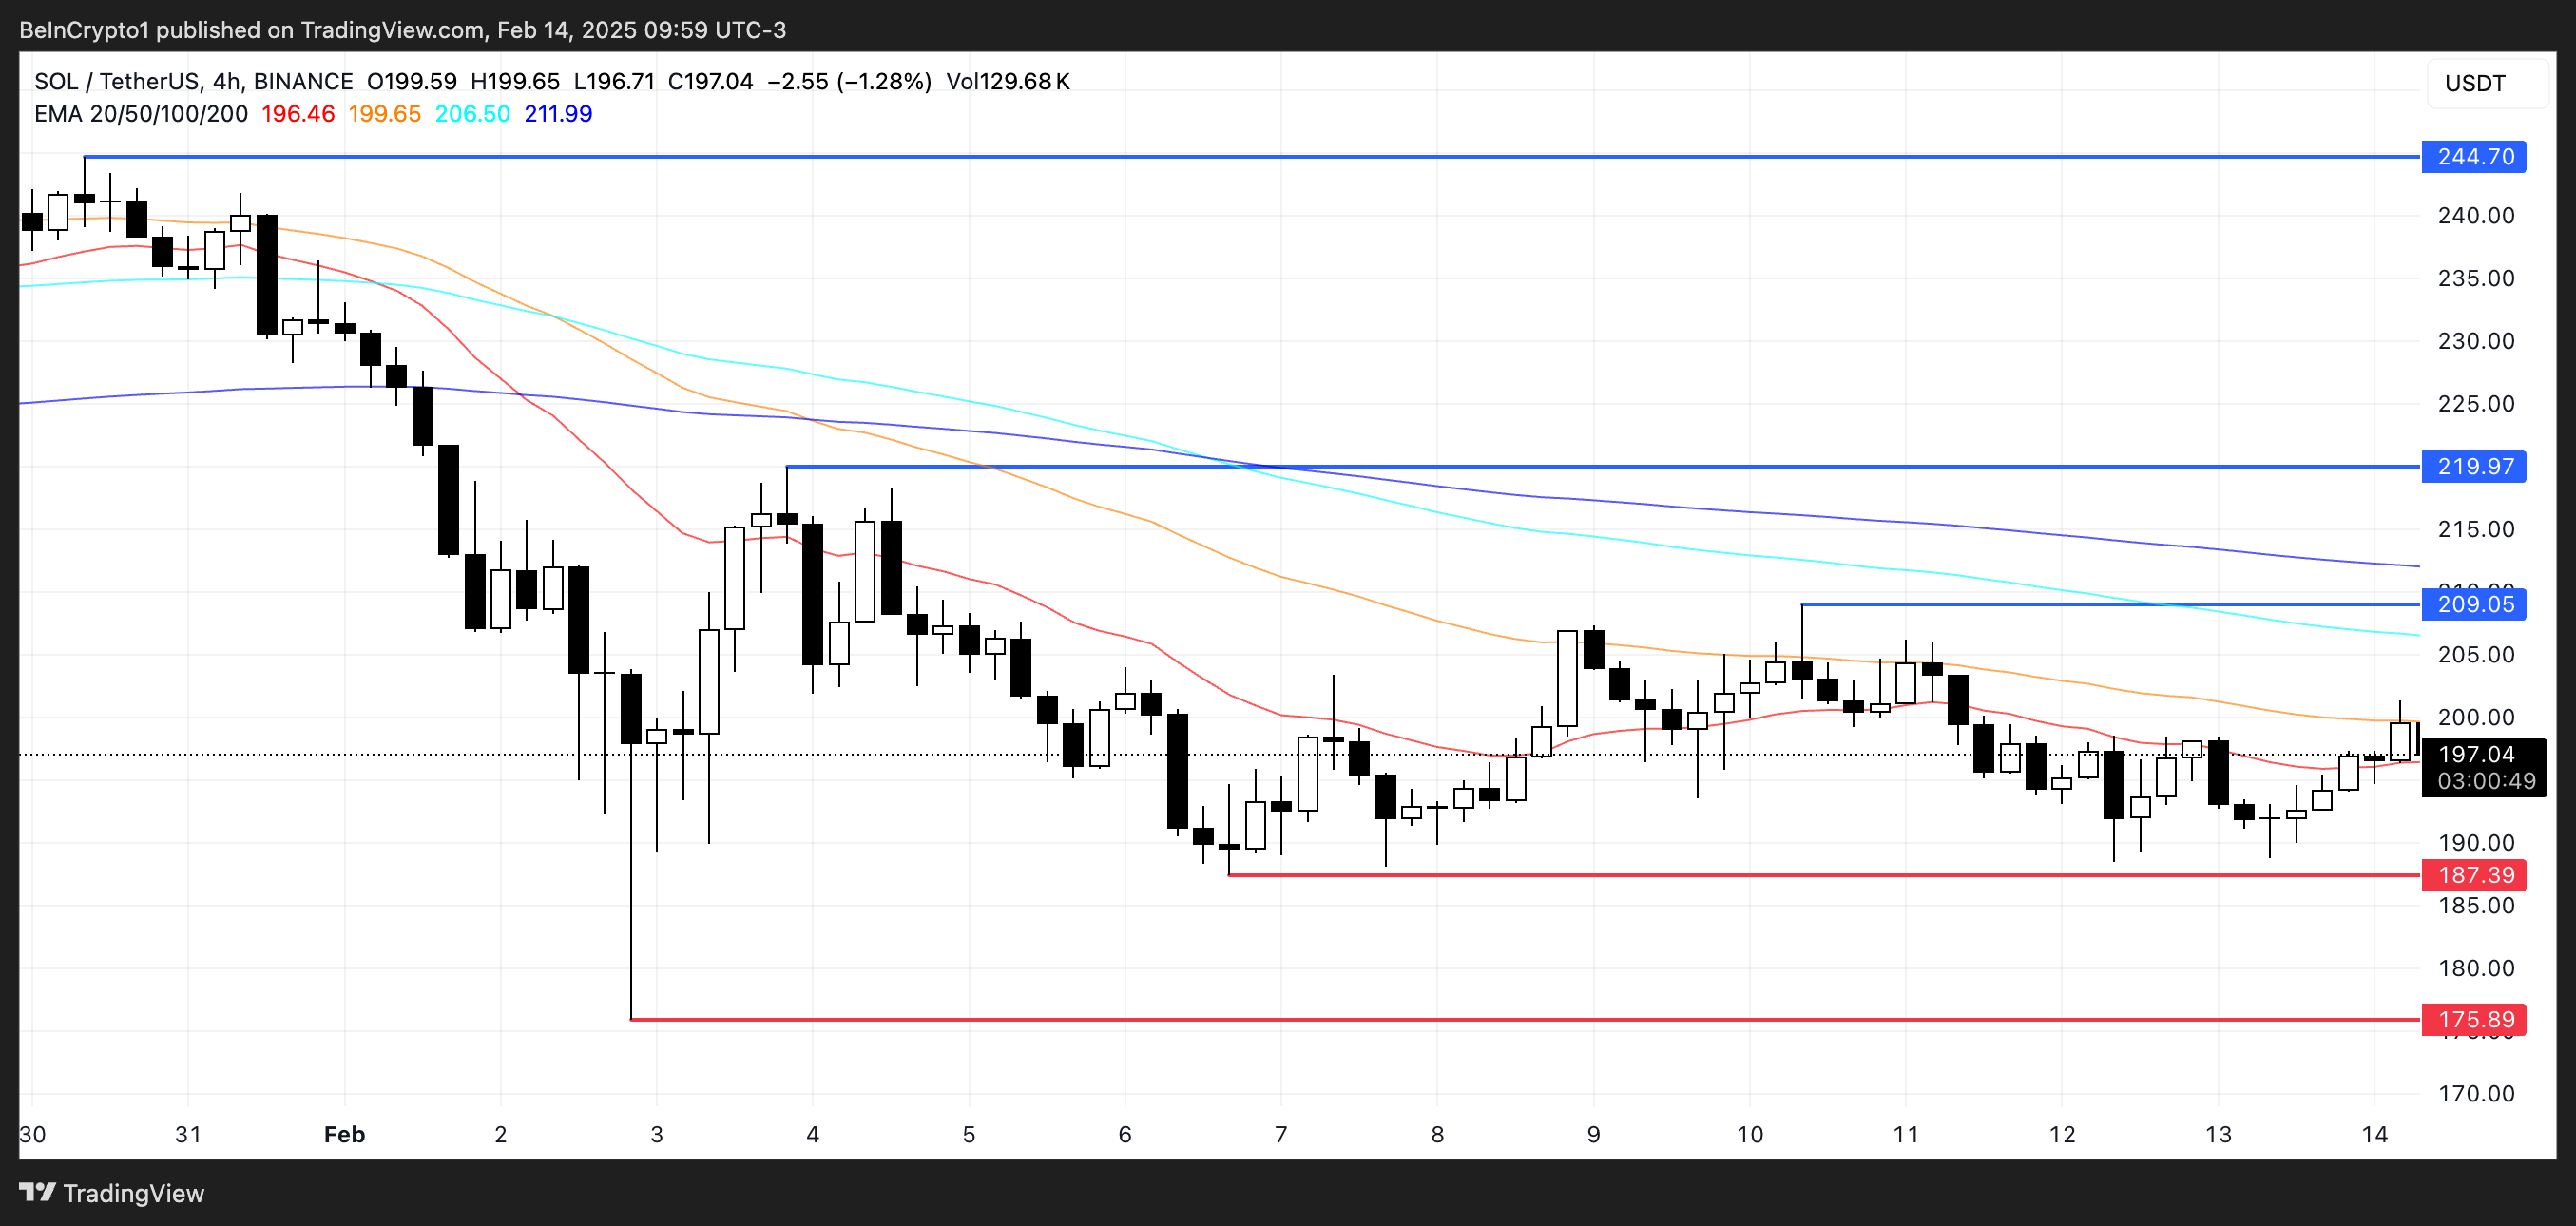
Source: TradingView
Disclaimer: This analysis is for informational purposes only and does not constitute financial advice. Conduct thorough research and consult a professional before making investment decisions.