SHIB Price Forms Symmetrical Triangle
Shiba Inu (SHIB) experienced a price drop in the last 24 hours, reflecting a broader market downturn. Currently trading near the $0.000012 support level, SHIB has formed a symmetrical triangle pattern following the sale of 77 million SHIB. This downward trend mirrors the declines seen in Bitcoin (BTC) and Ethereum (ETH).
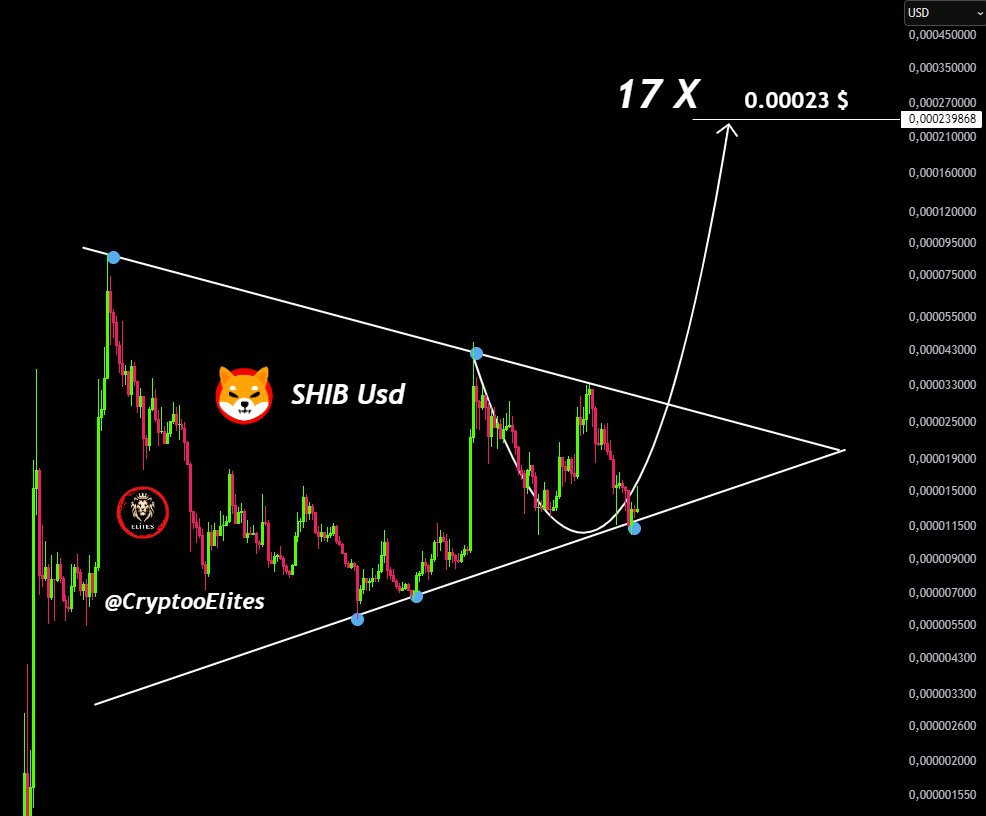
Shiba Inu Price: Symmetrical Triangle Formation
Crypto analysts observe that SHIB's symmetrical triangle pattern suggests an upcoming breakout. This consolidation period indicates potential for significant price movement. The price has oscillated within a narrowing range, hinting at a major price shift.
Analysts consider the current price a strong buy zone, predicting a potential near-term rise to $0.0023, representing a 17X increase. However, it's crucial to remember that this is a prediction, and market conditions are highly volatile.
77M SHIB Sold at a Loss: Market Shift?
The recent surge in SHIB's 30-day MVRV ratio above zero indicates increased investor demand. This positive sentiment, following a period of uncertainty, might have contributed to the recent price rebound. The MVRV ratio compares market price to the cost basis of tokens last moved; a positive value suggests a positive market outlook.

On March 20th, the sale of 77.64 million SHIB at a loss suggests a transfer of assets from weaker to stronger hands. Such shifts often precede price stabilization and can potentially trigger long-term growth as more committed investors accumulate SHIB.

SHIB Price: Potential Future Movement
At the time of writing, SHIB is trading at $0.00001280, showing a modest 3% decrease over the past 24 hours. The price seems to be consolidating within a descending channel pattern, visible on daily charts.
SHIB faces strong resistance around $0.000013, with support at $0.00001280. A breach below $0.00001250 could trigger a further pullback towards $0.000012, or potentially lower if selling pressure intensifies.
Technical indicators are currently bearish. The Relative Strength Index (RSI) stands at 36.37, below the neutral level, suggesting weakness. The Moving Average Convergence Divergence (MACD) line is also below the signal line, pointing towards further near-term bearish momentum.

Source: TradingView
Conversely, a break above $0.00001300 would signal a potential bullish reversal, with subsequent resistance levels at $0.00001350 and $0.00001400.
Frequently Asked Questions (FAQs)
- What does the symmetrical triangle pattern suggest? It indicates a period of consolidation, with the potential for a significant price movement in the near future.
- What is SHIB's current support level? The current support level is around $0.000012.
- What is the significance of the 77M SHIB sell-off? This large sell-off likely represents a shift in ownership from weaker to stronger hands, often leading to increased price stability.
Disclaimer: This analysis reflects the author's opinion and is subject to market volatility. Conduct thorough research before investing in cryptocurrencies. Codeum is not responsible for any financial losses.