Pi Network Price Dips: Analysis & Outlook
Pi Network Price Correction: A Technical Analysis
Pi Network (PI) experienced a recent price decline, falling below $0.60 after a brief rally. Over the past seven days, PI is down more than 8.5%, trading below $0.65 for six consecutive days. This analysis delves into the technical indicators to understand the current market dynamics and potential future price movements.
Ichimoku Cloud Signals Mixed Signals
PI remains below the Ichimoku Cloud, a bearish indication. However, a Tenkan-sen (conversion line) crossing above the Kijun-sen (base line) suggests a potential bullish shift. This is a preliminary signal, though, and requires confirmation through increased volume and a sustained move above the cloud. The future cloud remains red, indicating continued resistance. The Chikou Span (lagging line) is also below the price candles and cloud, further supporting the lack of confirmation for an upward trend. A decisive move above the cloud, coupled with a green future cloud and bullish Ichimoku signals, would be necessary for a sustained trend reversal. Currently, the market shows indecision.

Source: TradingView
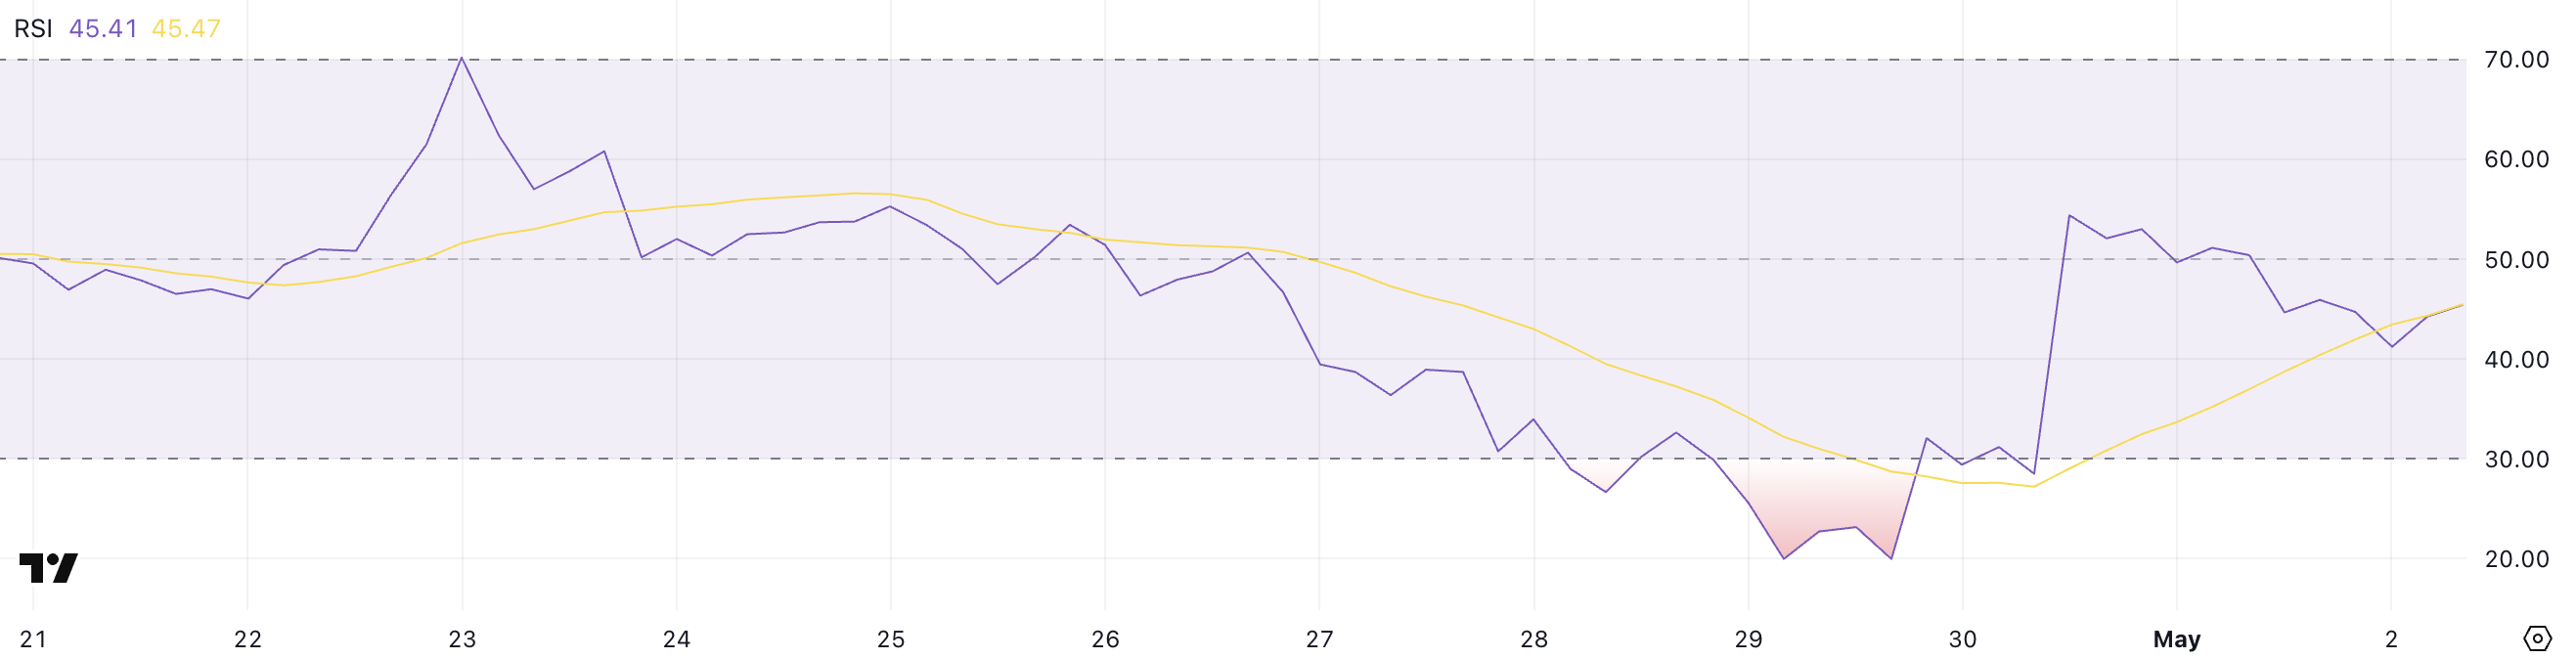
RSI Shows Weakening Momentum
The Relative Strength Index (RSI) recently dropped below 50 after a brief spike, currently at 45.41. This indicates fading bullish momentum and a shift towards a more neutral market sentiment. A quick reversal from above 50 highlights the uncertainty in the current trend. While readings below 30 suggest oversold conditions, the current level (above 30) hints at a neutral to slightly bearish outlook unless the RSI turns upward. Further declines could indicate increasing selling pressure and potential for additional price weakness.
Source: TradingView
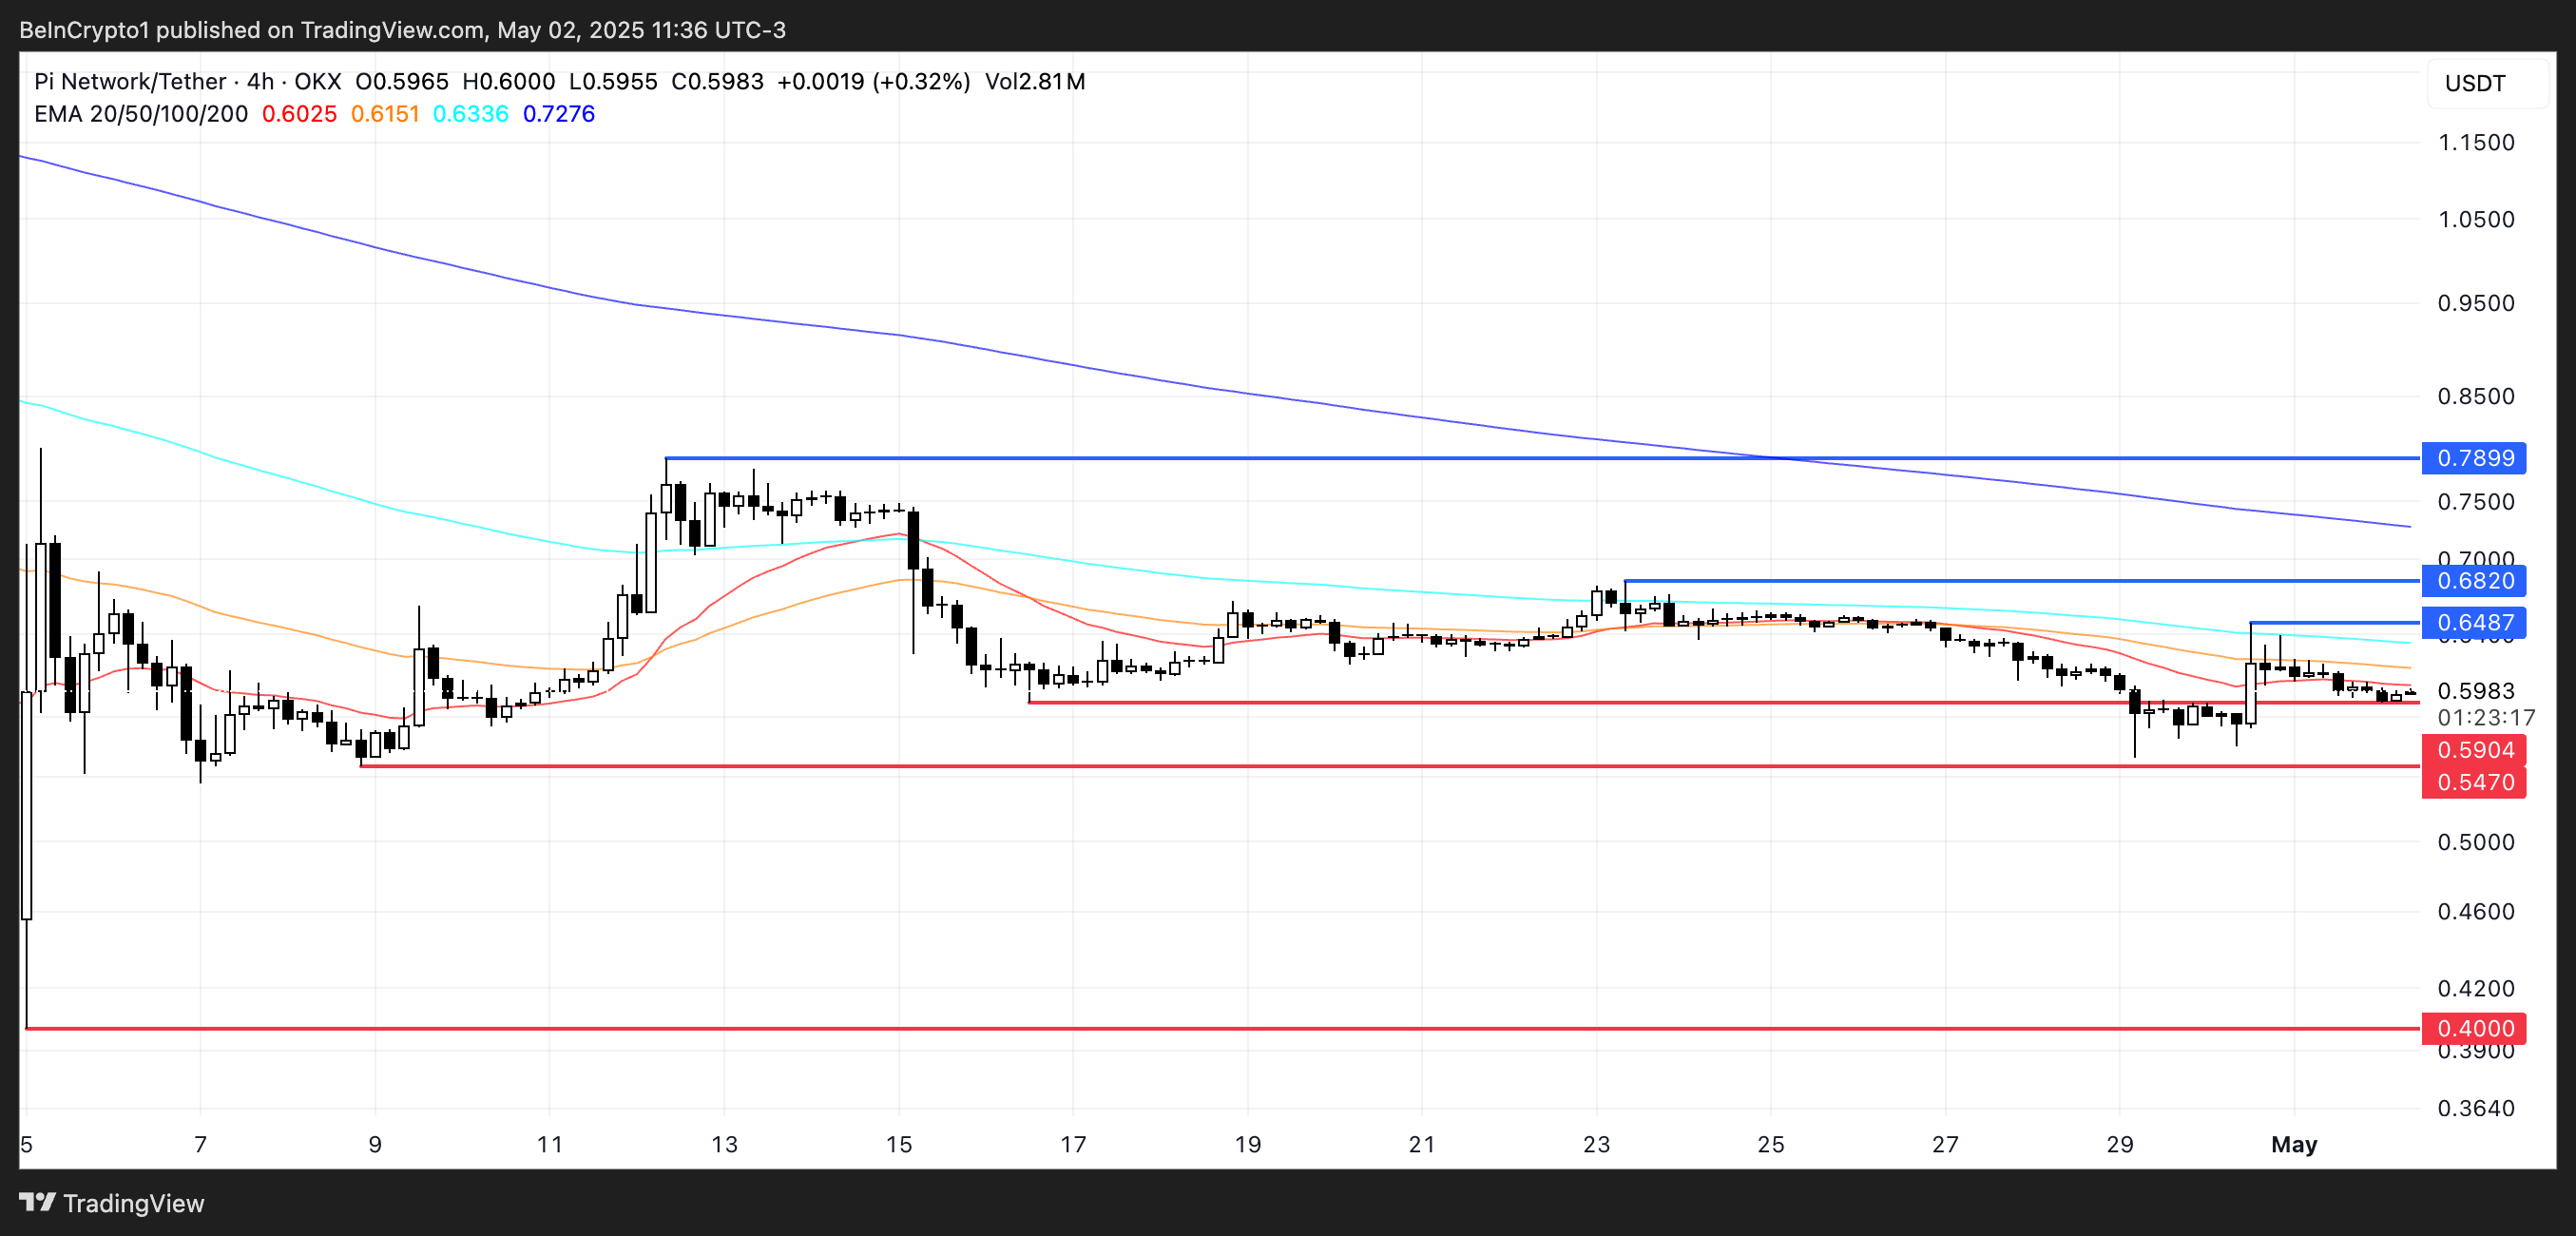
Key Support Levels and EMA Alignment
PI is trading just above key support at $0.59. A break below this level could lead to further declines, with the next support levels at $0.547 and $0.40. The Exponential Moving Averages (EMAs) are currently arranged in a bearish configuration, with short-term EMAs below long-term EMAs, reinforcing the downward trend. A bullish reversal would require a move above resistance at $0.648 and $0.682, with confirmation through increased volume and a bullish EMA crossover. Such a move could potentially push PI towards $0.789, signaling a sustainable uptrend.
Source: TradingView
Conclusion
Pi Network's price action shows indecision. While short-term bullish signals exist, the overall trend remains bearish until confirmed otherwise. Further price movements depend heavily on whether buyers can overcome the current resistance levels and maintain upward momentum. This analysis is for informational purposes only and not financial advice.
Disclaimer: This analysis is for informational purposes only and should not be considered financial advice. Codeum is a blockchain security and development platform offering smart contract audits, KYC verification, custom smart contract and DApp development, tokenomics and security consultation, and partnerships with launchpads and crypto agencies. Always conduct your own thorough research before making any investment decisions.