Hedera (HBAR) Price Surge: Bullish Signals?
Hedera (HBAR) Price Shows Promising Bullish Signals
Hedera (HBAR) has seen a recent price increase, prompting analysis of potential future price movements. While there have been minor corrections, several technical indicators point to a bullish outlook for HBAR. This analysis examines these signals to assess the possibility of further gains.
Strong Buying Pressure: A Look at the DMI
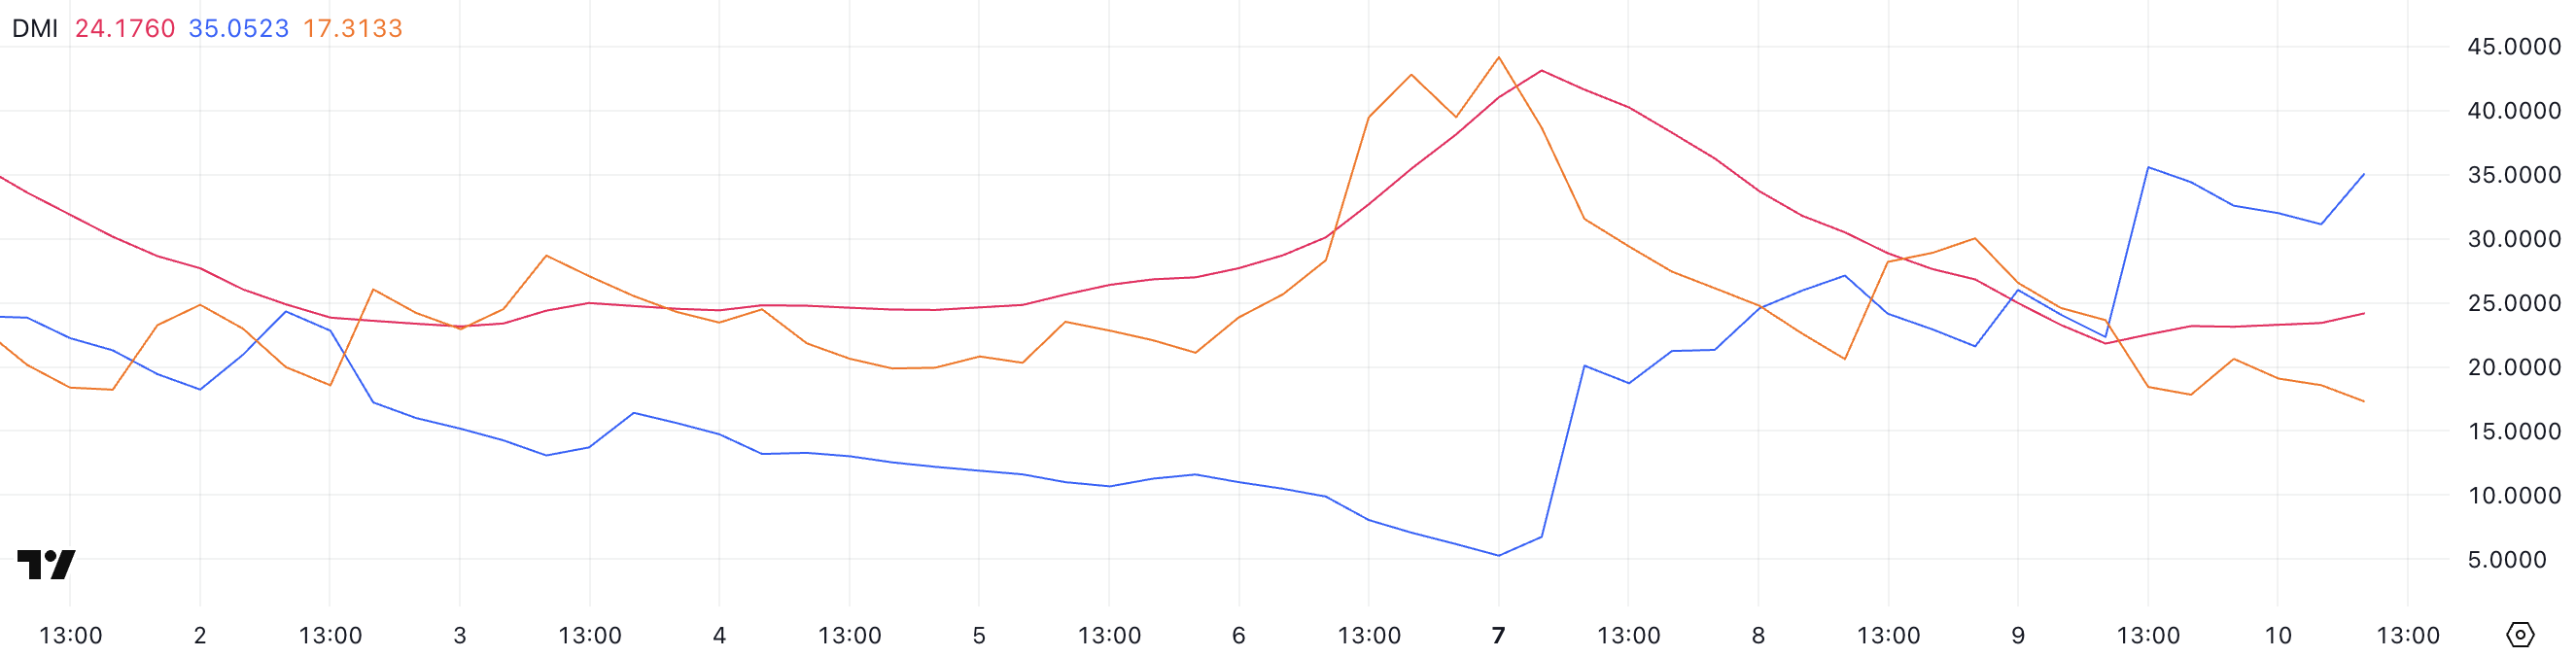
The Average Directional Index (ADX) on Hedera's DMI chart is rising, currently at 24.17, indicating strengthening trend momentum. Values above 25 typically signal a strong trend. The positive Directional Indicator (+DI) at 35.05 significantly outweighs the negative Directional Indicator (-DI) at 17.31, highlighting strong buyer dominance.
This widening gap between +DI and -DI suggests a clear shift in favor of buyers and a potential uptrend, especially if the ADX continues its upward trajectory and surpasses 25. This is a positive technical signal for short-term HBAR price action.
Bullish Ichimoku Cloud Setup
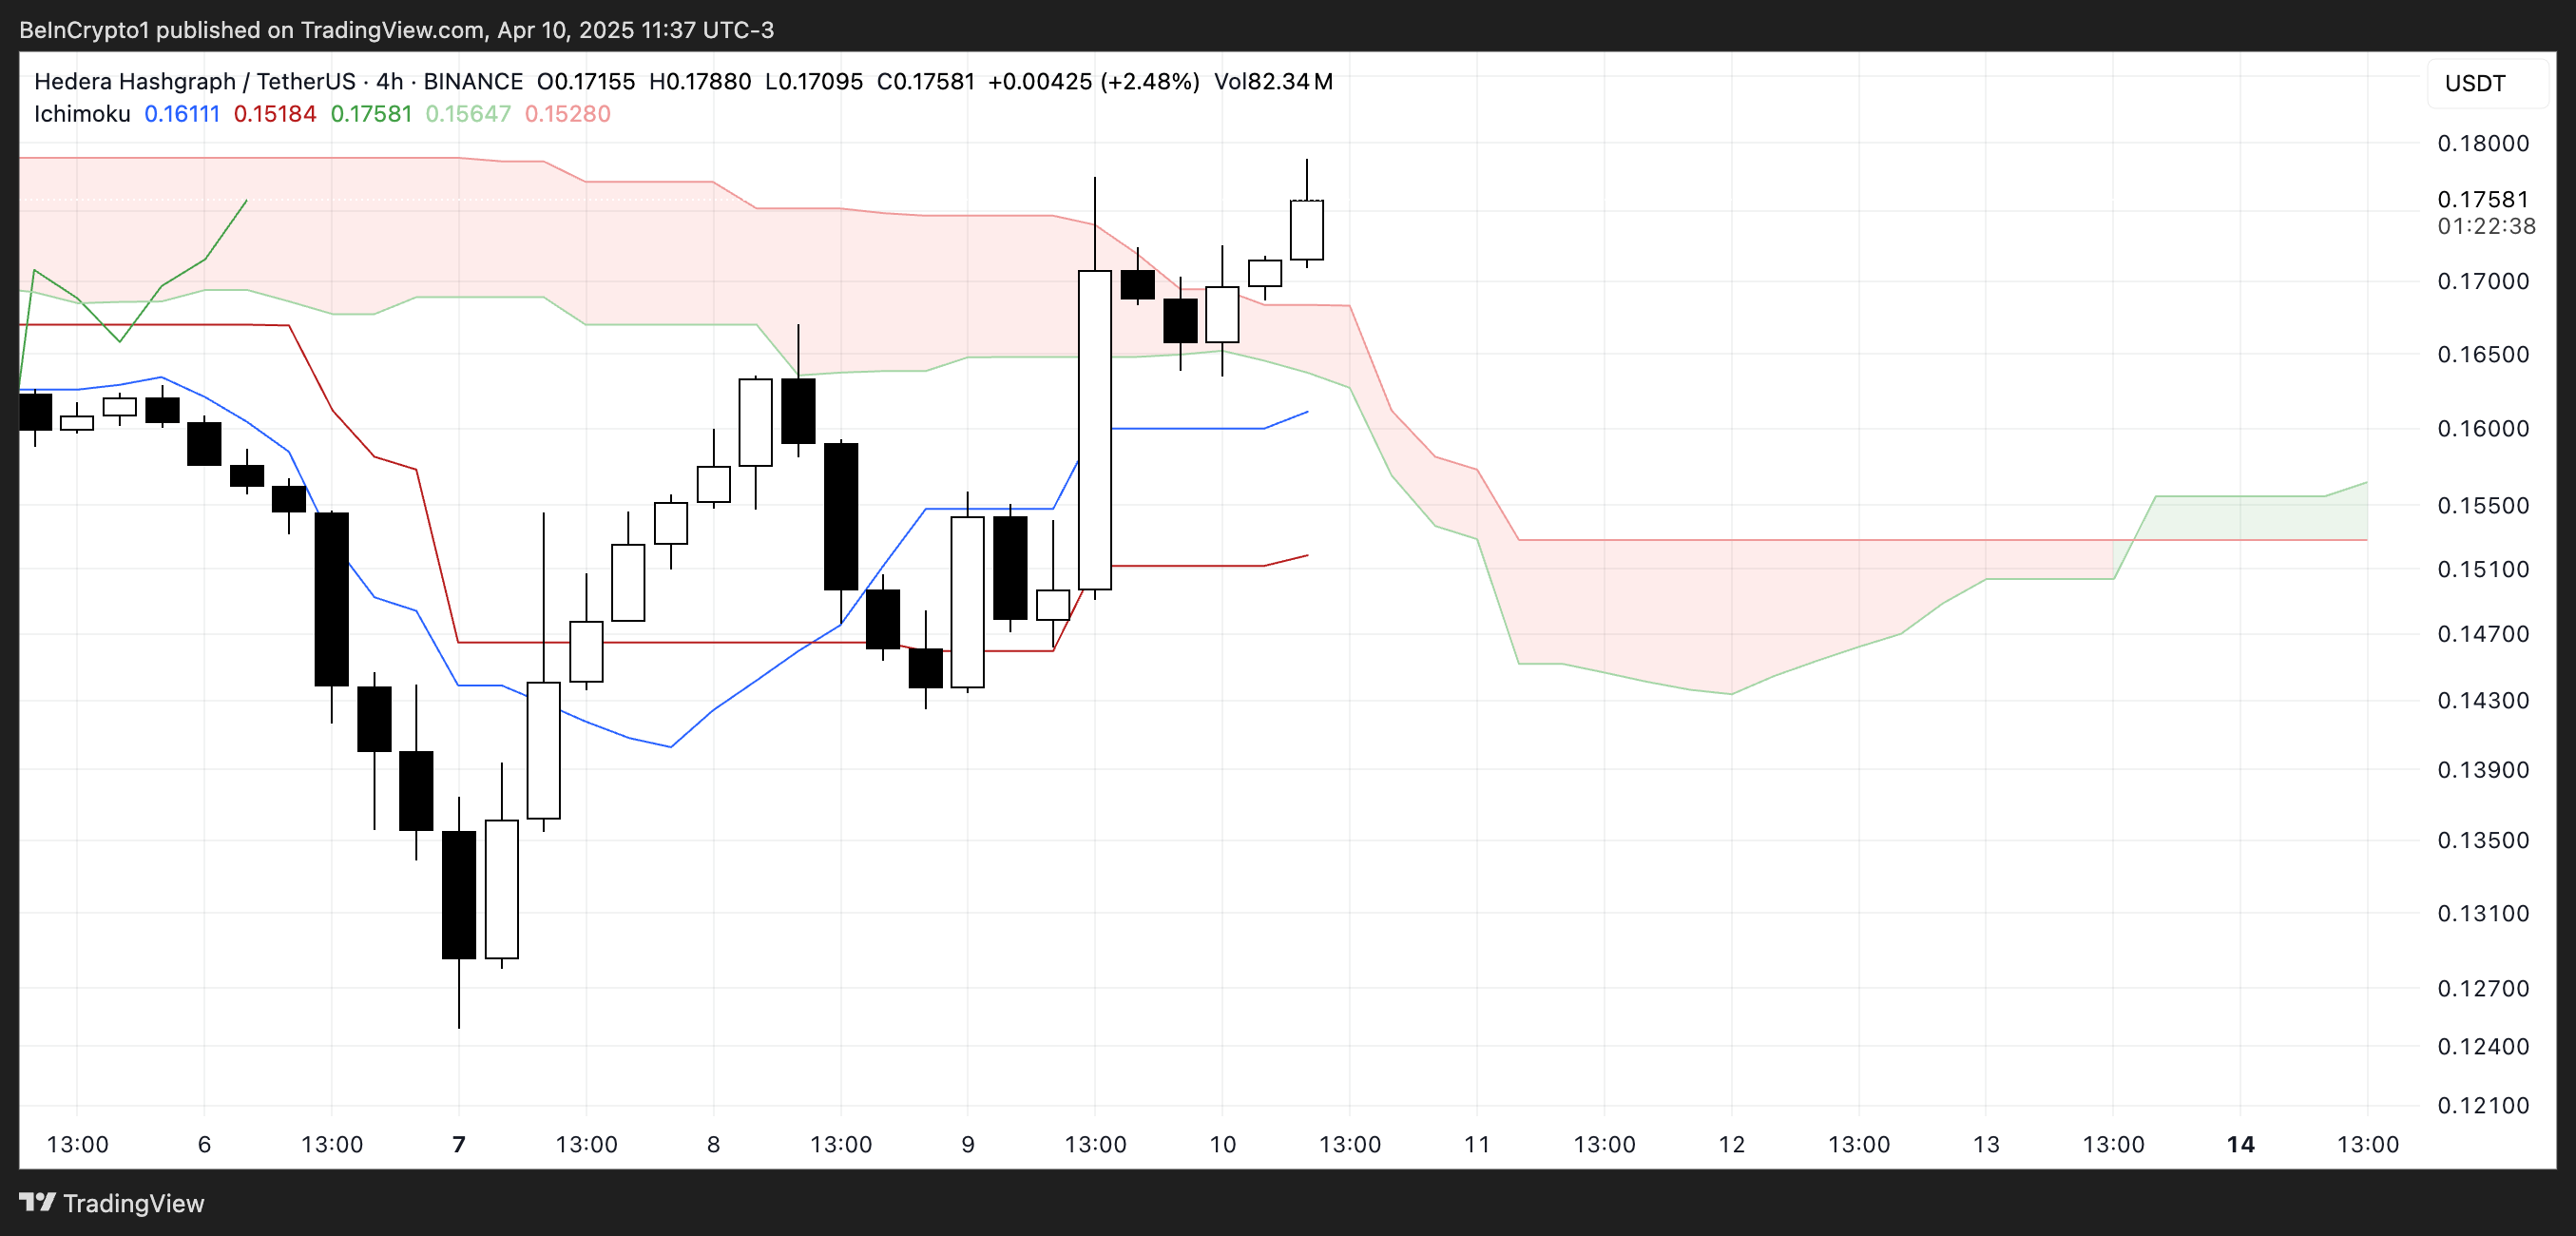
Hedera's Ichimoku Cloud chart displays a bullish configuration. The price has decisively broken above the red cloud (Kumo), trading above both the Tenkan-sen (blue line) and the Kijun-sen (red line). This is a key indicator of bullish momentum and short-term trend strength.
The thinning cloud suggests weakening resistance. The Chikou Span (lagging green line) is above both the price and the cloud, further reinforcing the bullish sentiment. However, the cloud's relatively flat structure currently limits the strength of the continuation signal. Maintaining price above the cloud and Tenkan-sen staying above Kijun-sen are crucial for sustaining this upward trajectory.
Potential Golden Cross and Price Targets
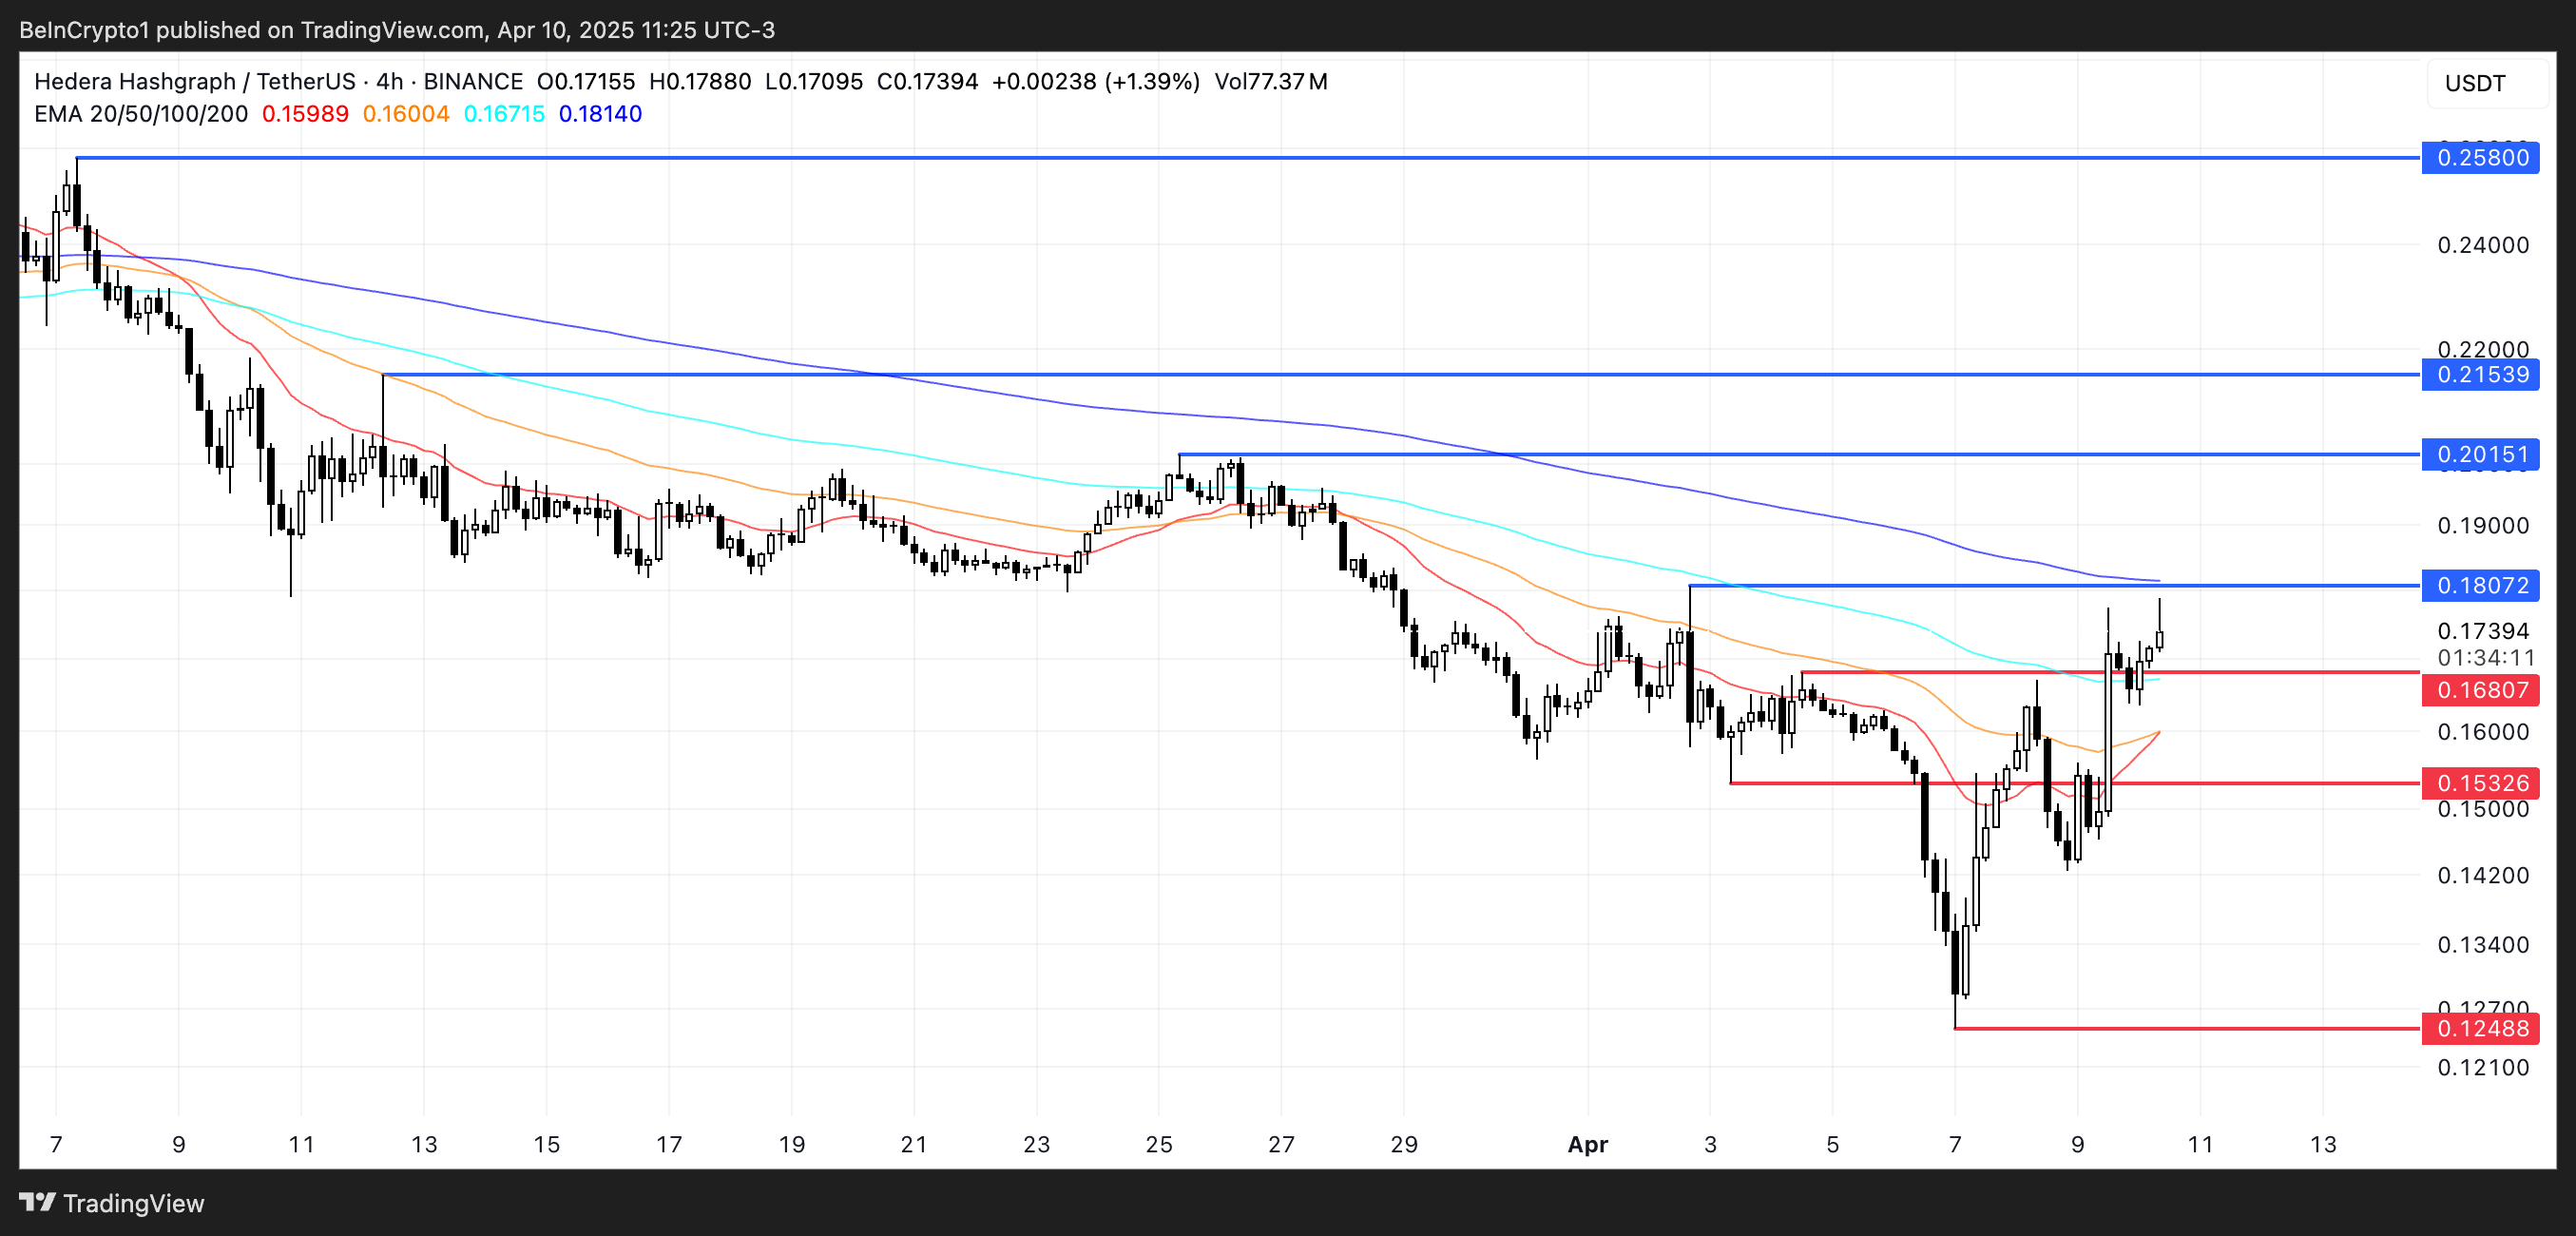
Hedera's EMA lines are converging, hinting at a potential golden cross—where short-term EMAs move above long-term ones. This would be a classic bullish signal, potentially pushing HBAR towards resistance levels at $0.18 and $0.20. If momentum sustains, further targets like $0.21 and $0.258 could be in play.
However, breaking above the immediate resistance at $0.18 is critical. Failure to do so might trigger a pullback towards support at $0.168. A breach below this support could expose HBAR to further downside, with subsequent key support levels at $0.153 and potentially below $0.13.
Disclaimer: This analysis is for informational purposes only and should not be considered financial or investment advice. Market conditions are subject to change. Always conduct your own research.
Codeum Note: At Codeum, we provide comprehensive blockchain security solutions, including smart contract audits, KYC verification, and custom DApp development. Partner with us to build secure and robust blockchain applications.