Hedera (HBAR) Price Analysis: Recovering, But Bearish Signals Remain
Hedera (HBAR) experienced a nearly 5% increase in the last 24 hours, attempting to break above the $0.20 mark for the first time in two weeks. While this rally suggests improving technical signals, HBAR still faces significant resistance and a predominantly bearish market sentiment from recent weeks.
Hedera BBTrend: Recovering, Yet Negative
Hedera's BBTrend currently sits at -1.85, a recovery from -3.44 the previous day, though it reached 0.96 just two days prior. This short-term improvement in price momentum follows recent downward pressure. However, the overall trend remains negative as HBAR struggles to sustain bullish signals. The indicator reflects the token's attempted recovery within a broader pattern of weak momentum.

The BBTrend (Bollinger Band Trend) indicator measures price deviation from the Bollinger Bands' center, assessing trend strength and direction. Values above 0 indicate bullish conditions, while values below 0 suggest bearish momentum. Hedera's current -1.85 reading points to persistent bearish pressure despite the recent bounce. The last time the BBTrend crossed above 10 was on March 6th, highlighting the fleeting nature of recent bullish momentum.
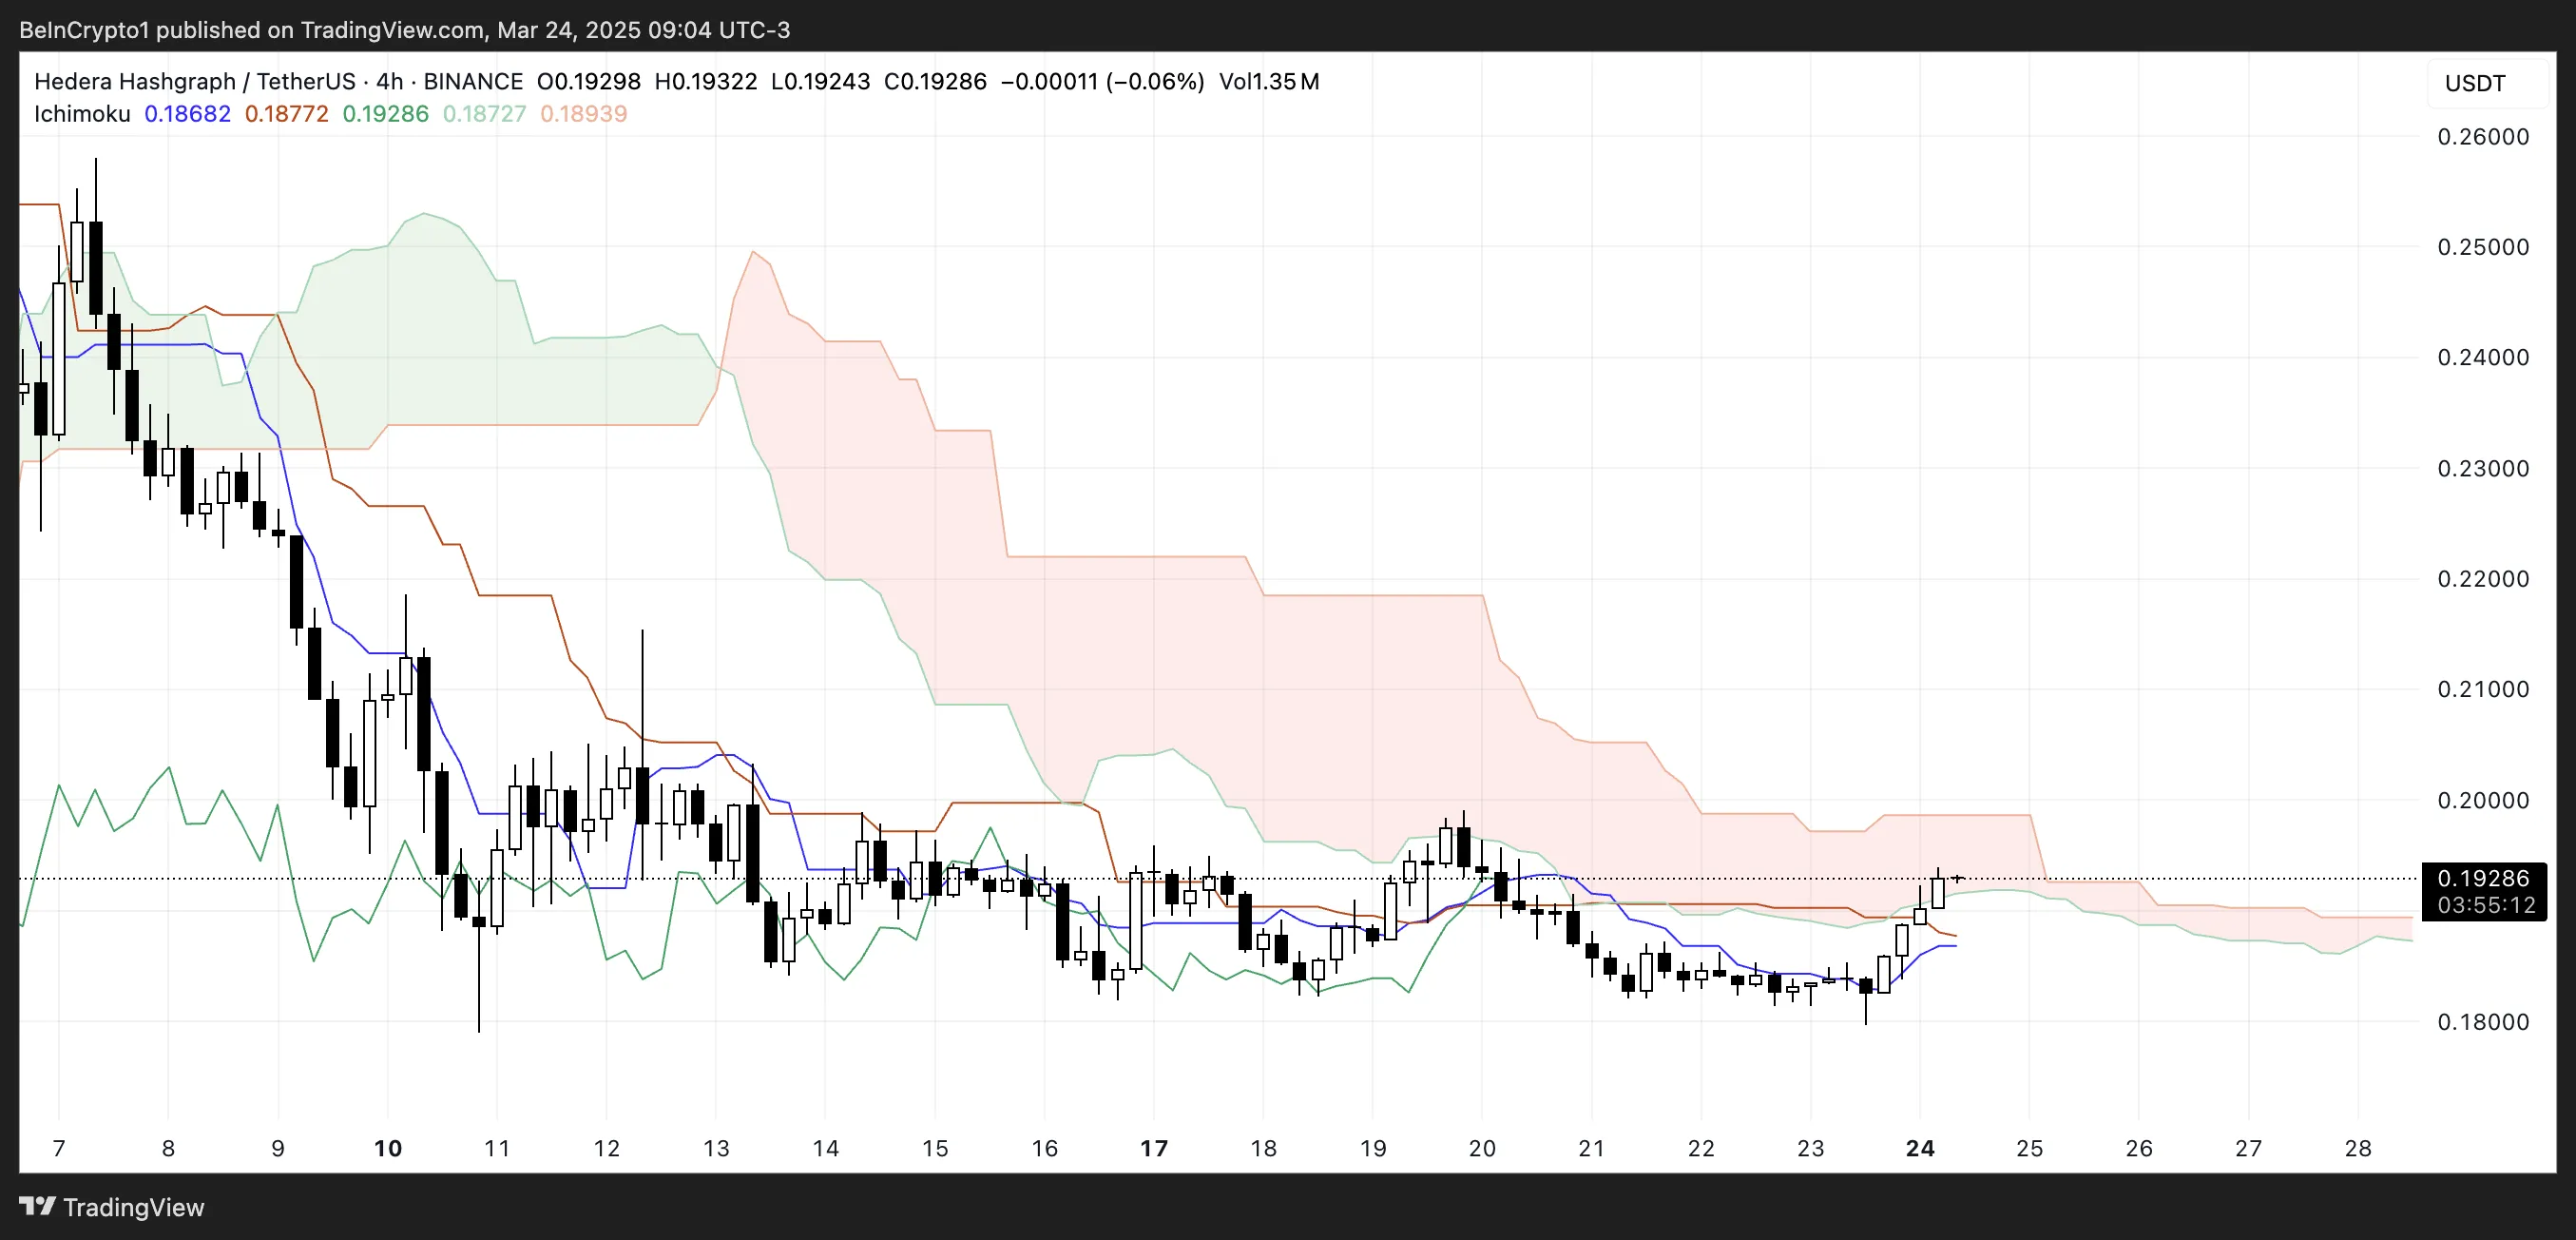
HBAR Ichimoku Cloud: Potential Shift, Challenges Remain
Hedera's Ichimoku Cloud chart displays early recovery signs. The price has broken above the blue Tenkan-sen line and is testing the red Kumo (cloud) bottom. This movement into the cloud, after extended trading below, suggests a shift from bearish to more neutral conditions. Despite weakening selling pressure, resistance from the Kumo's thicker portion above current levels persists. The cloud's bearish (red) coloration indicates the broader trend remains under pressure.

The Ichimoku Cloud reveals support, resistance, trend direction, and momentum. Prices below the cloud suggest bearish conditions, while prices above signal bullish sentiment. Trading within the cloud indicates consolidation or market indecision. Hedera's current position suggests an attempt to neutralize bearish momentum without establishing a clear bullish trend. A decisive break above the cloud's upper edge is needed to unlock significant upside potential.
Golden Cross Potential for Hedera?
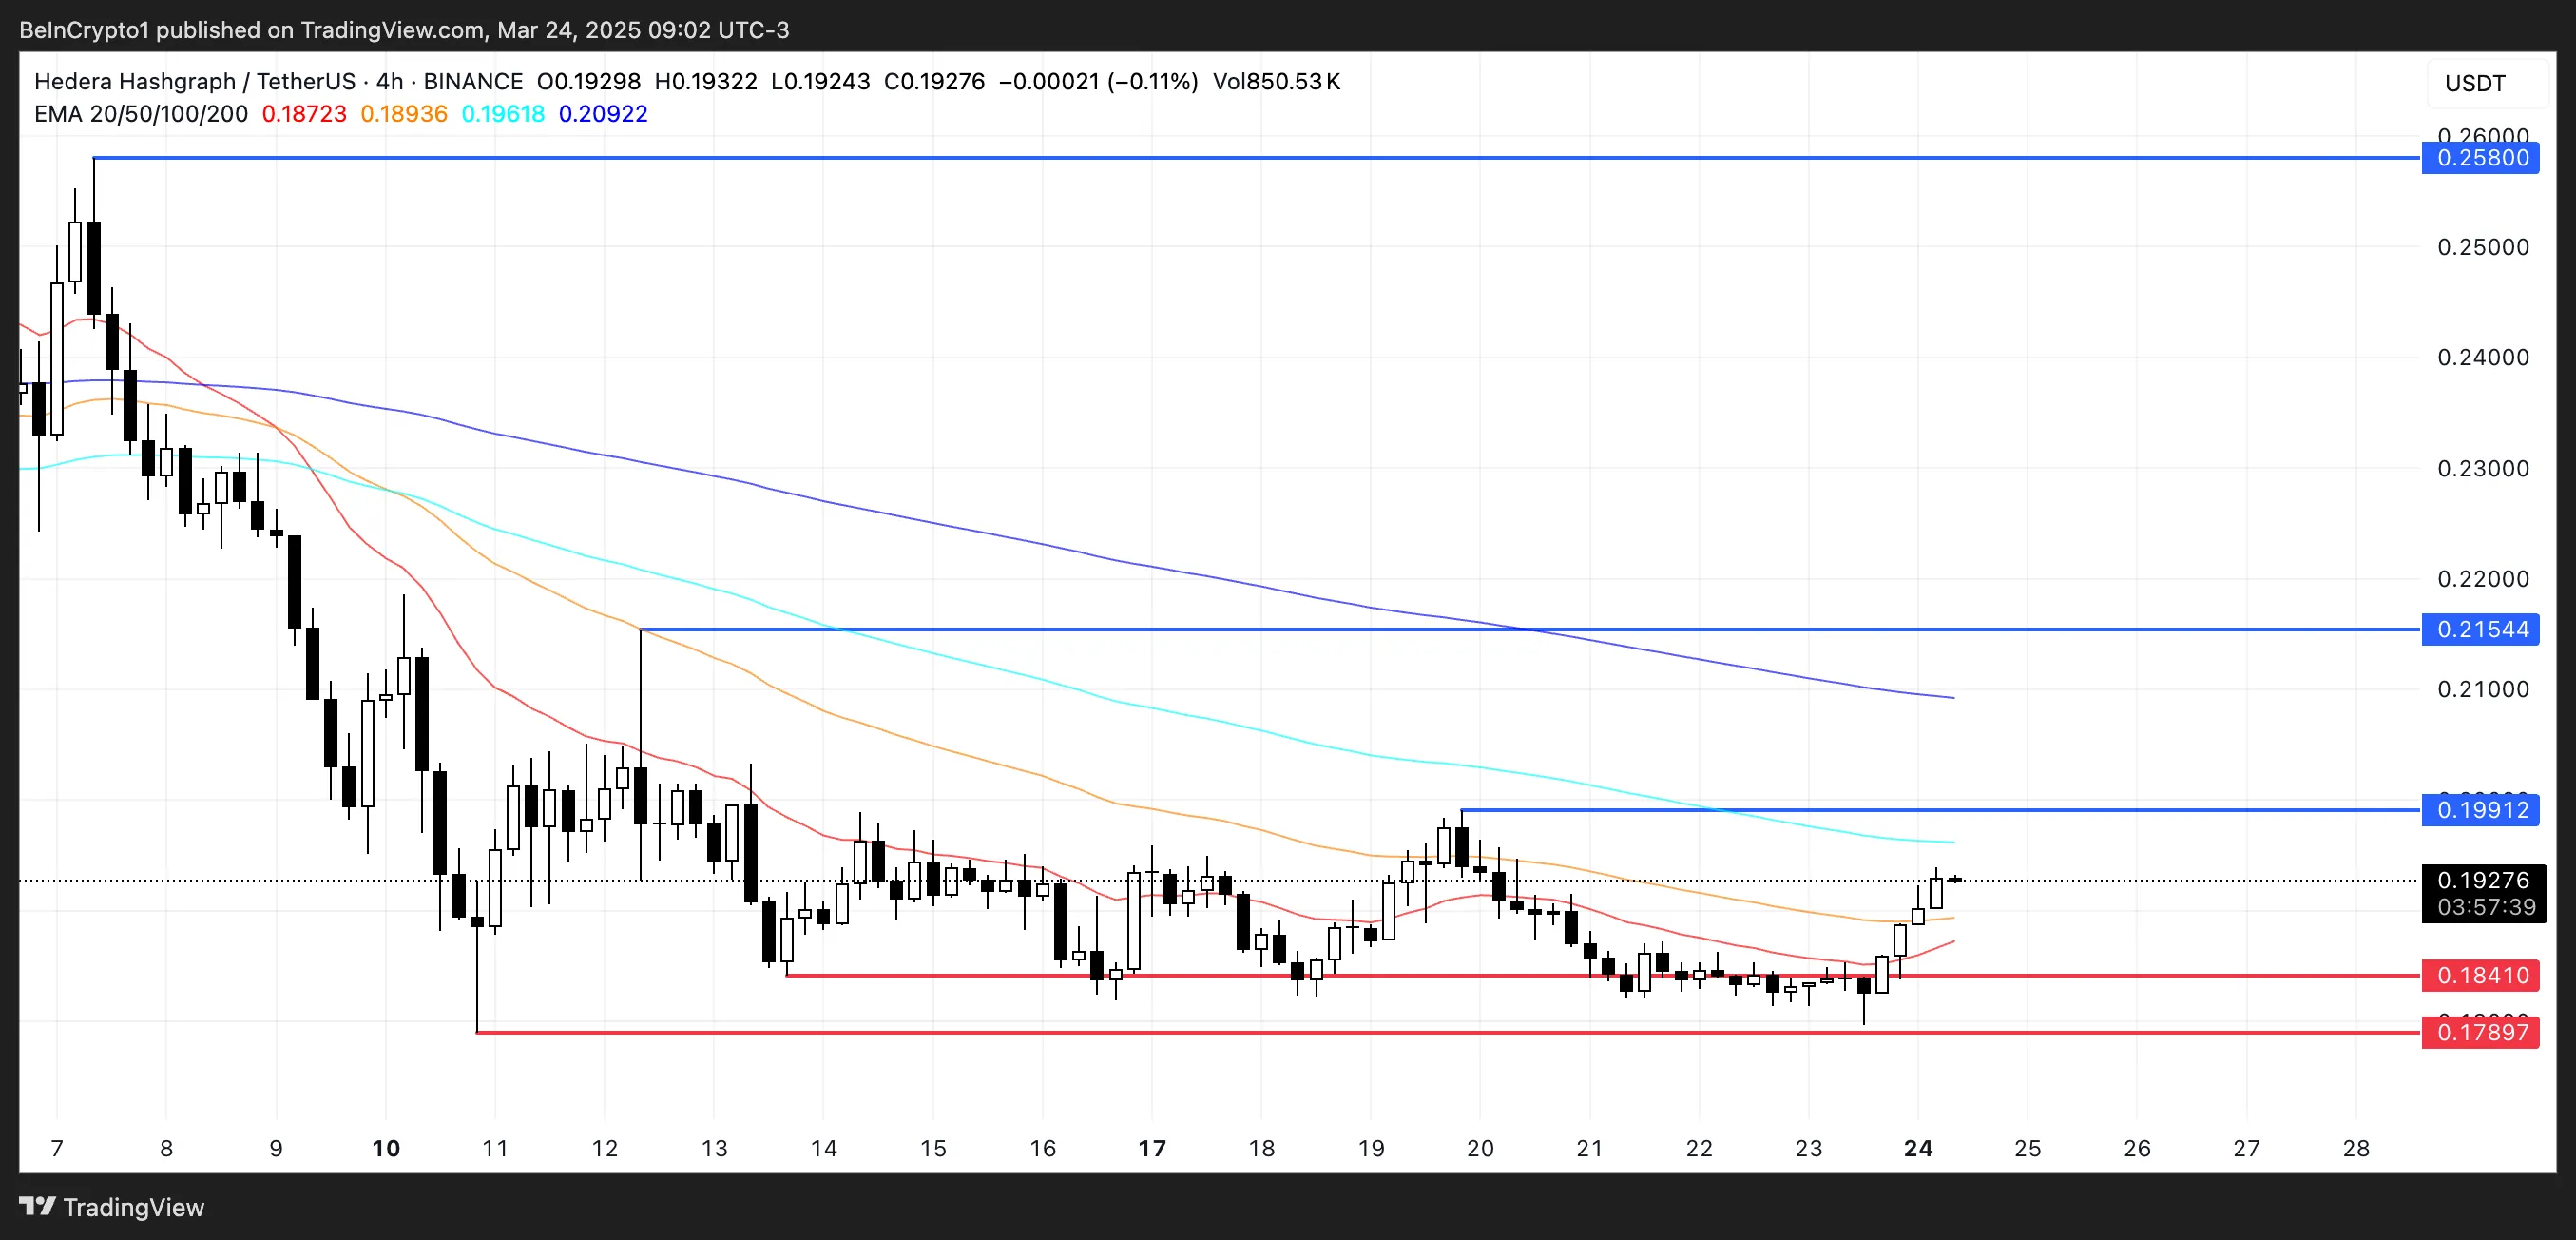
Hedera's EMA lines present a bearish setup overall, with long-term EMAs trending downward. However, short-term EMAs are sloping upwards and could soon form a golden cross by crossing above the longer-term averages. This bullish crossover might trigger stronger upward movement, with initial resistance at $0.199. Breaking this level could lead to gains toward $0.215, potentially even $0.258 with accelerating momentum.

Conversely, if short-term upward momentum fades and the golden cross fails, bearish pressure might resume, potentially pushing HBAR back to support levels at $0.184 and $0.178. A decisive break below these levels could reinforce the bearish structure and send the token below $0.17.
Codeum provides comprehensive blockchain security and development services, including smart contract audits, KYC verification, custom smart contract and DApp development, tokenomics and security consultation, and partnerships with launchpads and crypto agencies. Contact us to secure your project.