Hedera (HBAR) Price Analysis: Mixed Signals Amidst Market Transition
Hedera (HBAR), currently boasting a $7 billion market cap, presents a mixed market outlook. While some indicators point toward potential growth, recent trading activity reveals a 27% drop in the last 24 hours, bringing the volume down to $104.29 million.
HBAR Trend Weakness Eases, but Momentum Remains Uncertain
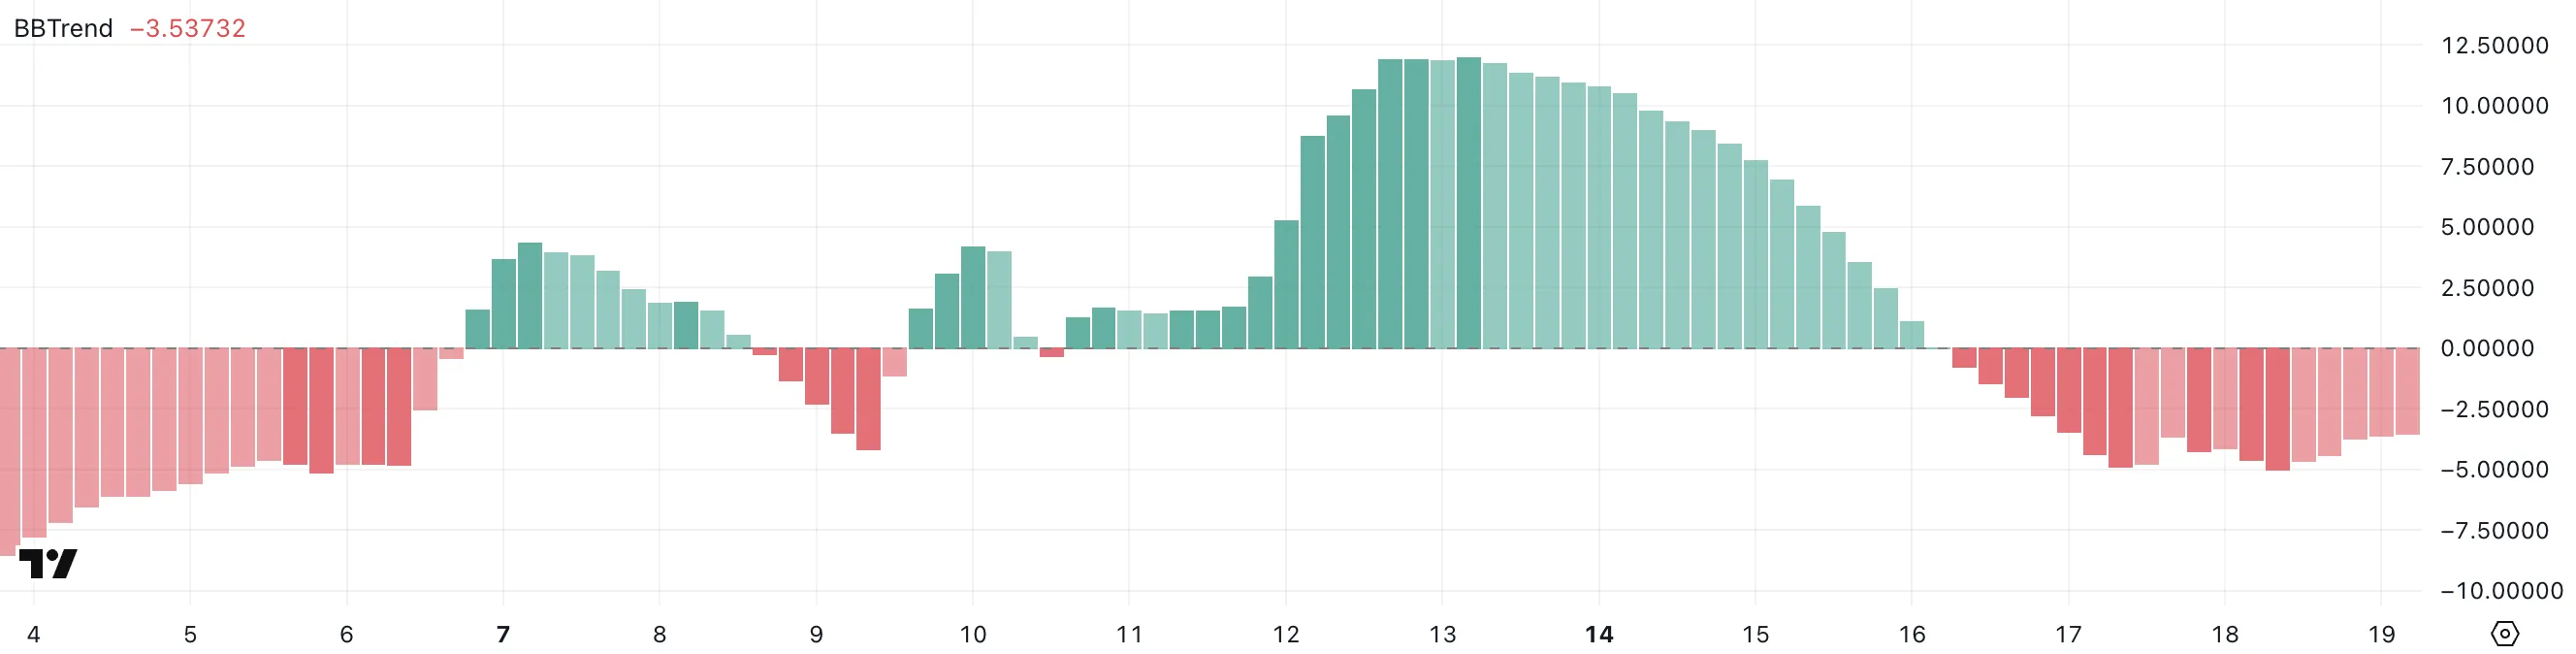
The BBTrend indicator, currently at -3.53, has been negative for three consecutive days, hitting a recent low of -5. While a slight recovery is observed, remaining below zero indicates weak momentum and limited directional price action. This prolonged dip suggests potential consolidation or a risk of a broader downtrend unless bullish momentum emerges.
BBTrend, or Bollinger Band Trend, analyzes Bollinger Band expansion/contraction to gauge trend strength and volatility. Positive values usually signal strong directional movement, while negative values indicate weakening trends. HBAR's negative BBTrend suggests a low-energy zone where neither buyers nor sellers clearly dominate.
Rising RSI Suggests Growing Bullish Momentum
Hedera's Relative Strength Index (RSI) is currently at 55.70, up from 45 two days ago. This upward trend reflects increased buying pressure and potential continuation of the upward push, provided momentum sustains. While below overbought levels, the steady rise suggests growing interest.
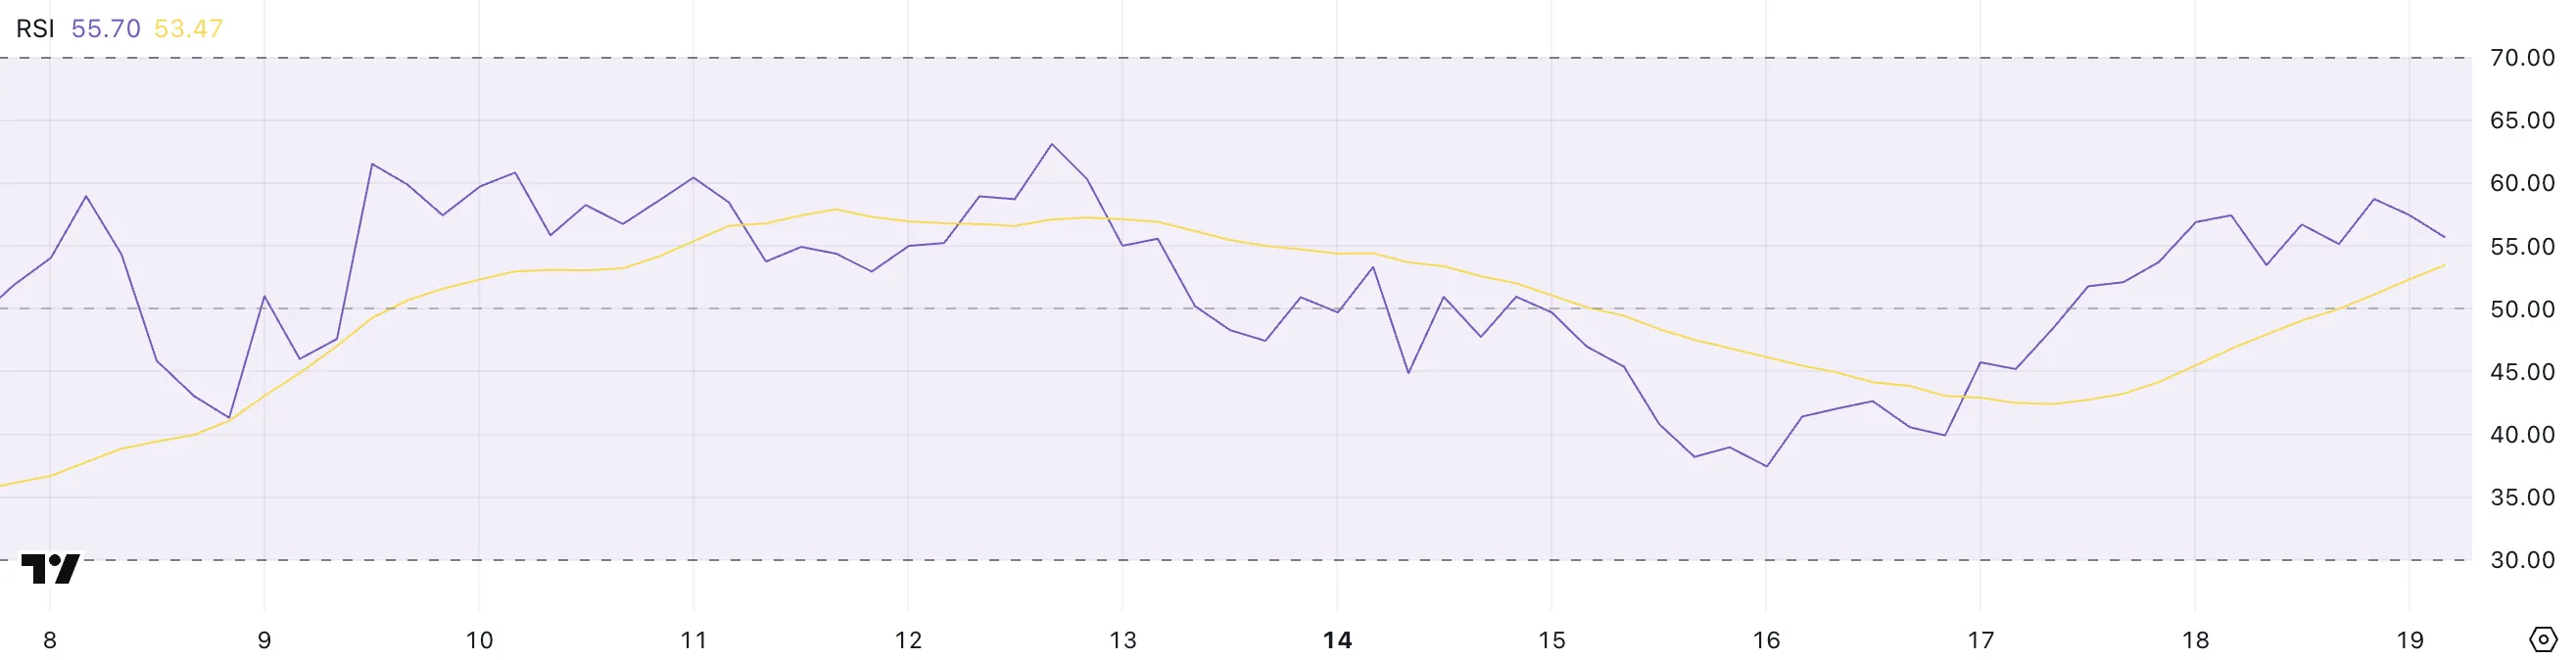
The RSI, a momentum oscillator measuring the speed and magnitude of price changes (0-100), considers readings above 70 overbought and below 30 oversold. At 55.70, HBAR is in neutral-bullish territory, suggesting potential upside before overbought conditions. A continued rise towards 70 could signal a short-term rally, but also potential exhaustion.
Potential Bullish Crossover, but Risks Remain
Hedera's EMA lines hint at a potential golden cross, suggesting a bullish trend shift. If this occurs and momentum strengthens, HBAR might test resistance at $0.178, potentially reaching $0.20 or even $0.258 (its highest since early March). However, support at $0.153 is crucial; failure to hold it could lead to a drop to $0.124.

While technical indicators lean bullish, the market remains uncertain. Traders should closely monitor these key levels for confirmation of a clear directional trend. At Codeum, we provide smart contract audits, KYC verification, and custom smart contract development to secure your blockchain projects.
Disclaimer: This analysis is for informational purposes only and not financial advice. Market conditions change rapidly. Conduct thorough research before making any financial decisions.