Hedera (HBAR) Price Analysis: Golden Cross Hope?
Hedera (HBAR) Price Analysis: Golden Cross Hope?
Hedera (HBAR) has faced downward pressure, losing over 17% in the last 30 days and trading below $0.20 since May 23. While some momentum indicators suggest a potential recovery, HBAR remains challenged by key resistance levels. Its BBTrend is negative, and the RSI, while recovering from oversold conditions, hasn't broken above 60. A golden cross in its EMA lines could spark a bullish rally, but stronger follow-through is crucial to overcome resistance.
Persistent Negative BBTrend Delays Potential Breakout
The BBTrend indicator highlights persistent bearish momentum for Hedera over the past two weeks. Since May 26, it has remained negative, reaching -12.54 on June 2. Currently at -0.195, the BBTrend indicates a potential easing of the downtrend, but overall sentiment remains weak. The negative BBTrend shows that bullish pressure hasn't firmly established itself.
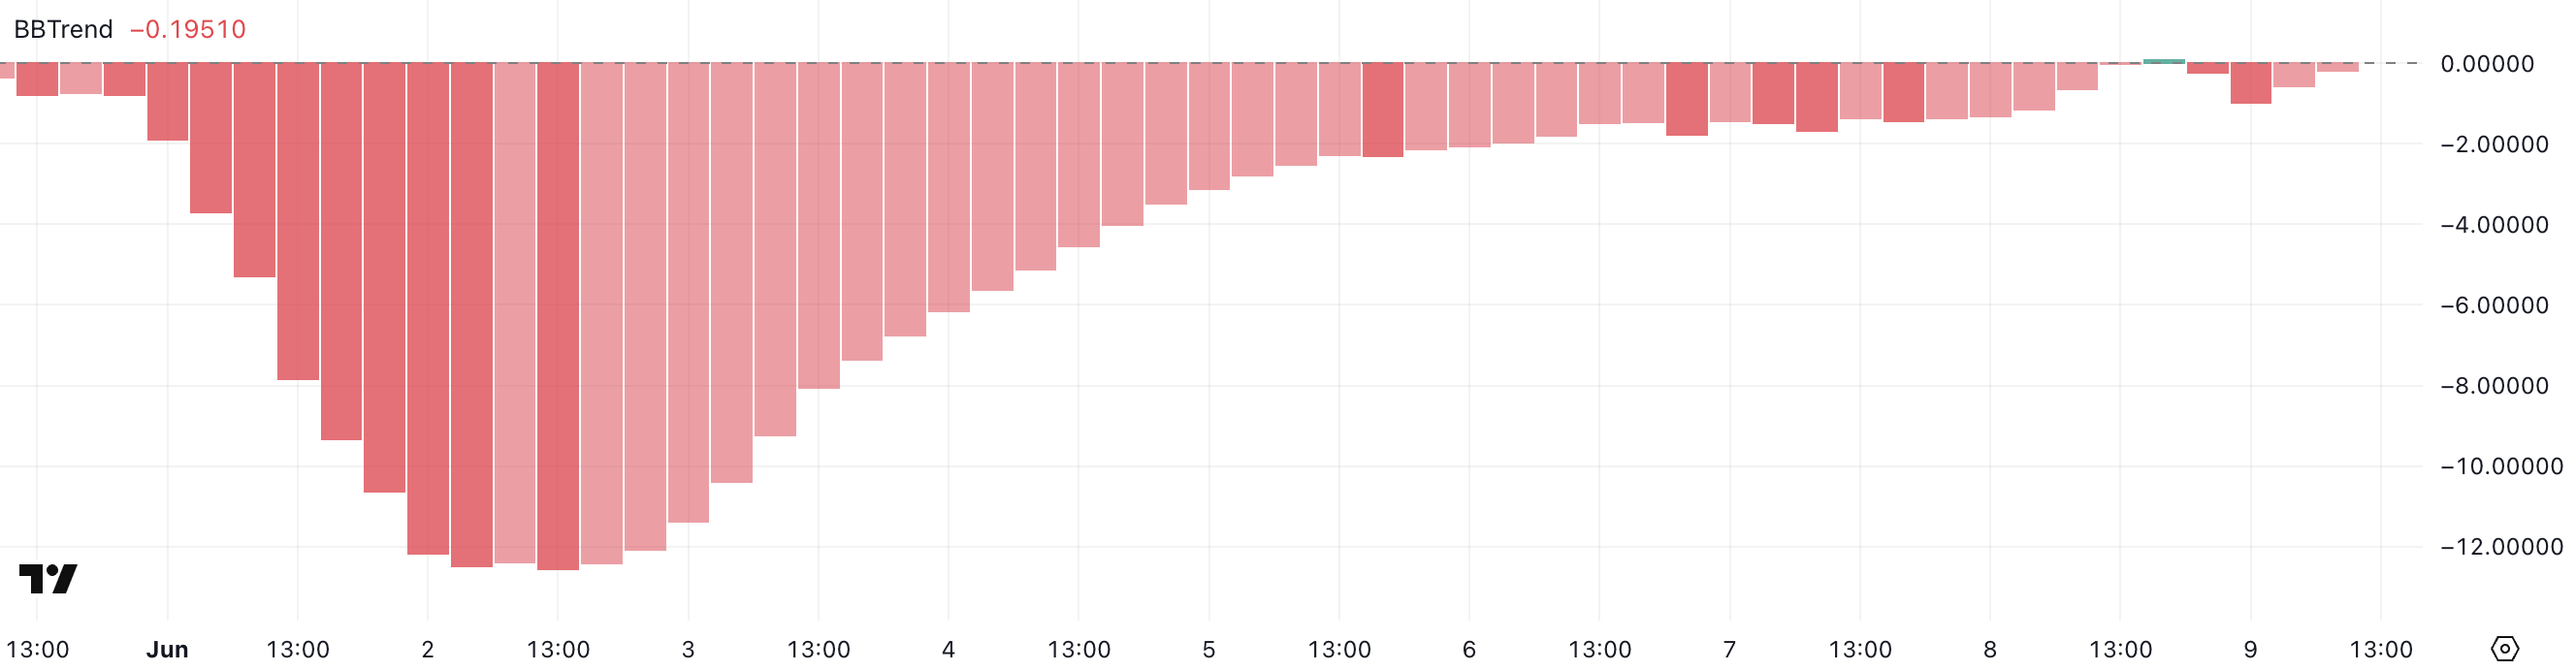
HBAR BBTrend. Source: TradingView
BBTrend, or Bollinger Band Trend, gauges price movement direction and strength based on price position relative to Bollinger Bands. A positive BBTrend signals bullish momentum, while a negative reading shows sustained selling pressure. HBAR's slightly negative BBTrend (-0.195) suggests caution; while extreme bearishness has eased, a bullish phase hasn't firmly begun.
HBAR RSI Recovers From Oversold Levels
Hedera displays signs of recovering momentum; its Relative Strength Index (RSI) is at 57.17, up significantly from 27.62 on June 5. Since June 6, the RSI has consistently remained above 50, suggesting growing buyer control. However, it has struggled to surpass 60 for three days, limiting bullish momentum.
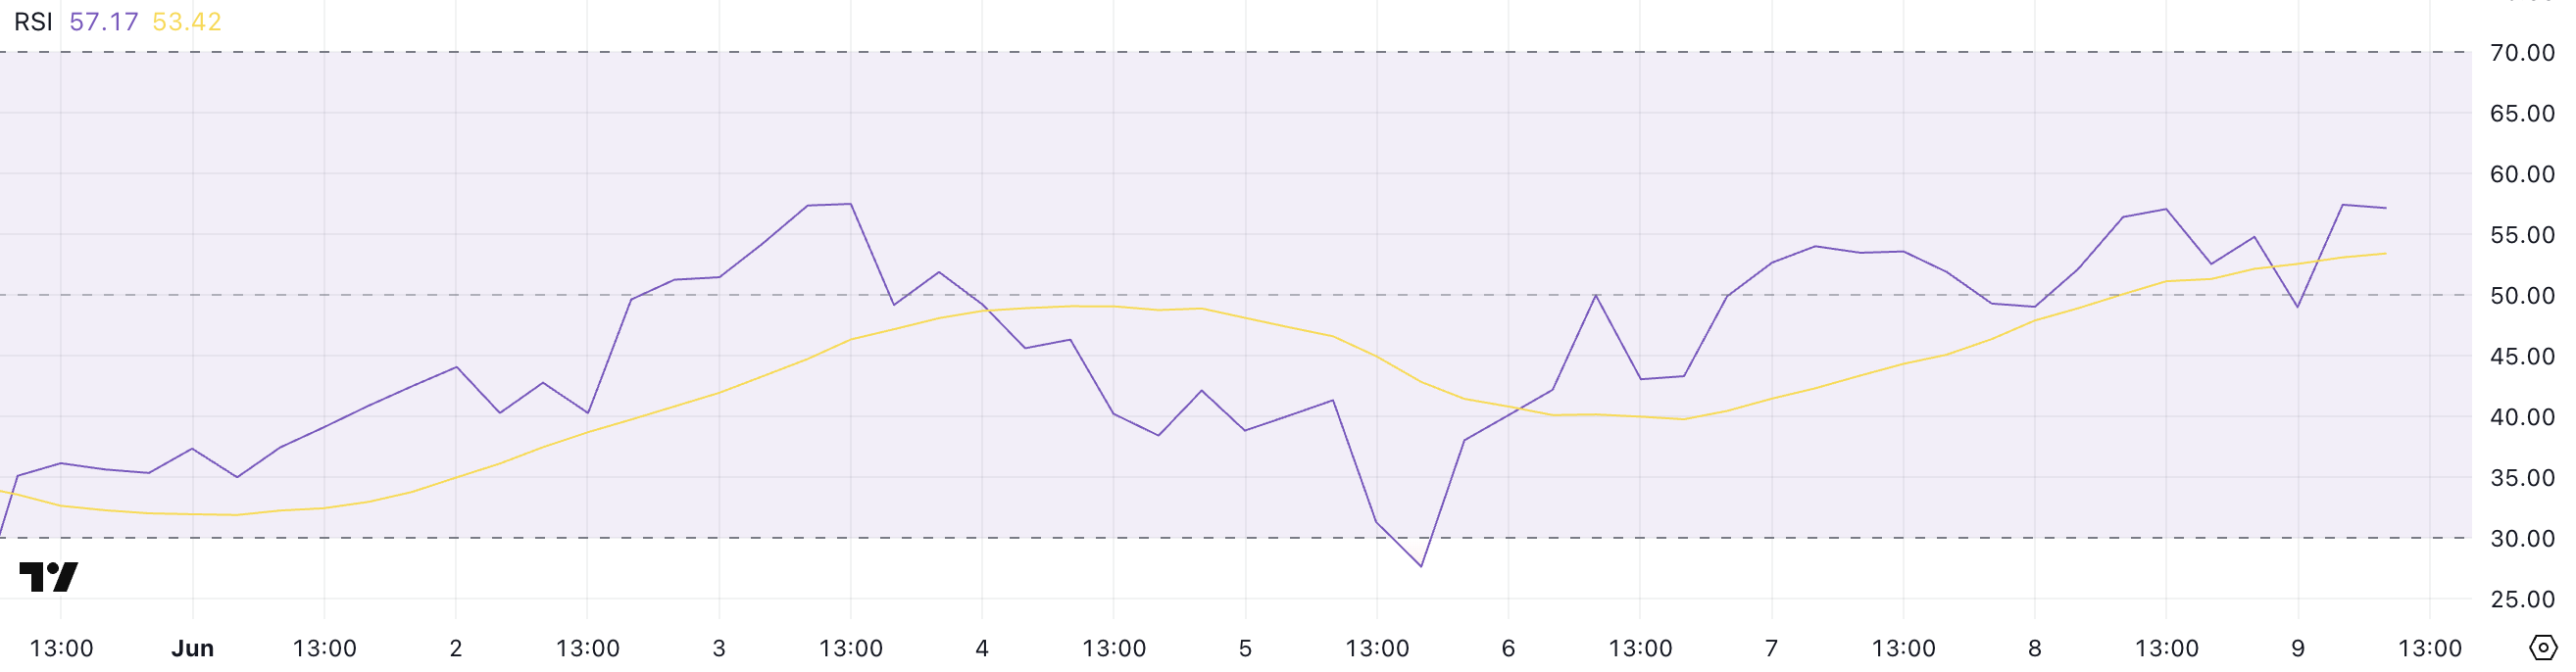
HBAR RSI. Source: TradingView
The RSI ranges from 0 to 100. Values above 70 indicate overbought conditions; below 30, oversold. Around 50 is neutral. HBAR's RSI in the 50-60 zone indicates a transition phase. A decisive break above 60 could open the way for further upside, but its recent struggles show that bulls lack conviction for a sustained rally.
Will Hedera Break $0.20?
Hedera's Exponential Moving Averages (EMAs) hint at a possible golden cross, a bullish signal where a short-term EMA crosses above a long-term EMA. This could push HBAR towards resistance at $0.175. A strong breakout could lead to $0.193 and potentially $0.209, reclaiming the $0.20 zone. However, sustained upward momentum is crucial. Failure to rally could see HBAR retreat to support at $0.160, potentially dropping to $0.155.
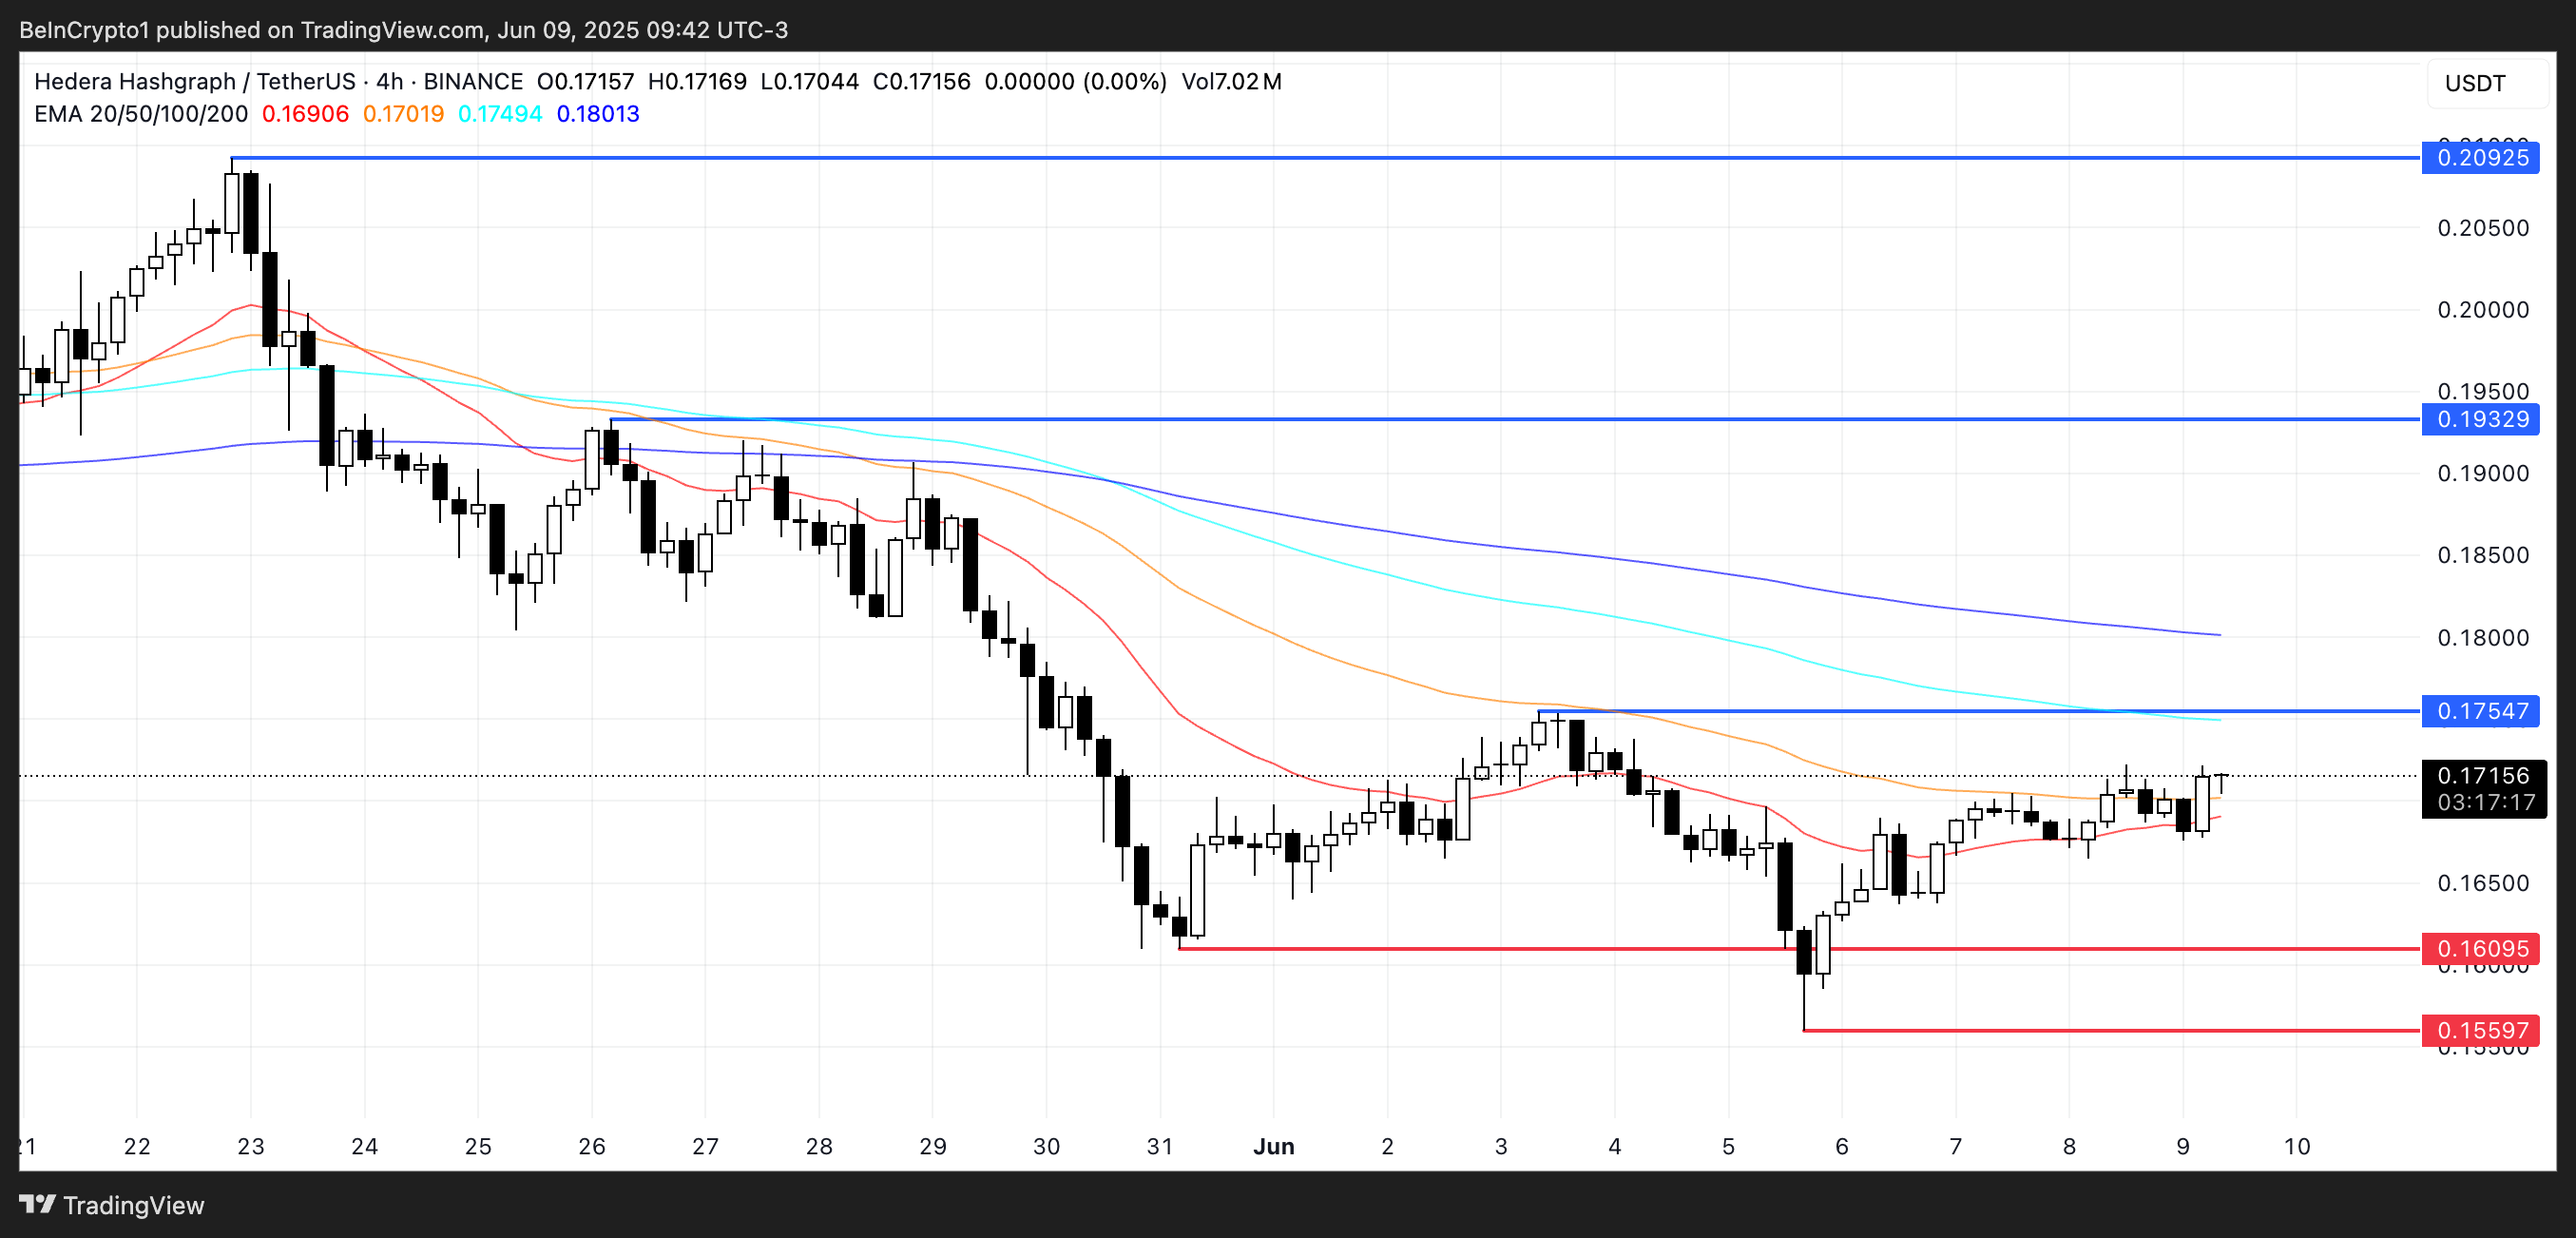
HBAR Price Analysis. Source: TradingView
Disclaimer: This analysis is for informational purposes only and does not constitute financial or investment advice. Market conditions are volatile. Conduct your own research and consult a professional before making financial decisions.