HBAR Price Analysis: Is a 40% Rally on the Horizon?
HBAR Price Eyes Significant Upswing Amid Bullish Signals
HBAR price is currently trading around $0.236, marking a 10.6% increase over the past week (as of September 11). While still down 3.7% for the month, the token has seen more substantial gains of 53% over the past three months, maintaining a positive trend.
Recent weeks have revealed several bullish indicators, including notable whale activity. Coupled with a key momentum pattern and a broader chart breakout, these signs indicate that HBAR may be gearing up for a rally nearing 40%.
Whale Accumulation and RSI Confirmation
Whale activity has been particularly noticeable since the beginning of the week. Between September 6 and September 11, the number of accounts holding over 10 million HBAR increased from 117.76 to 119.54.
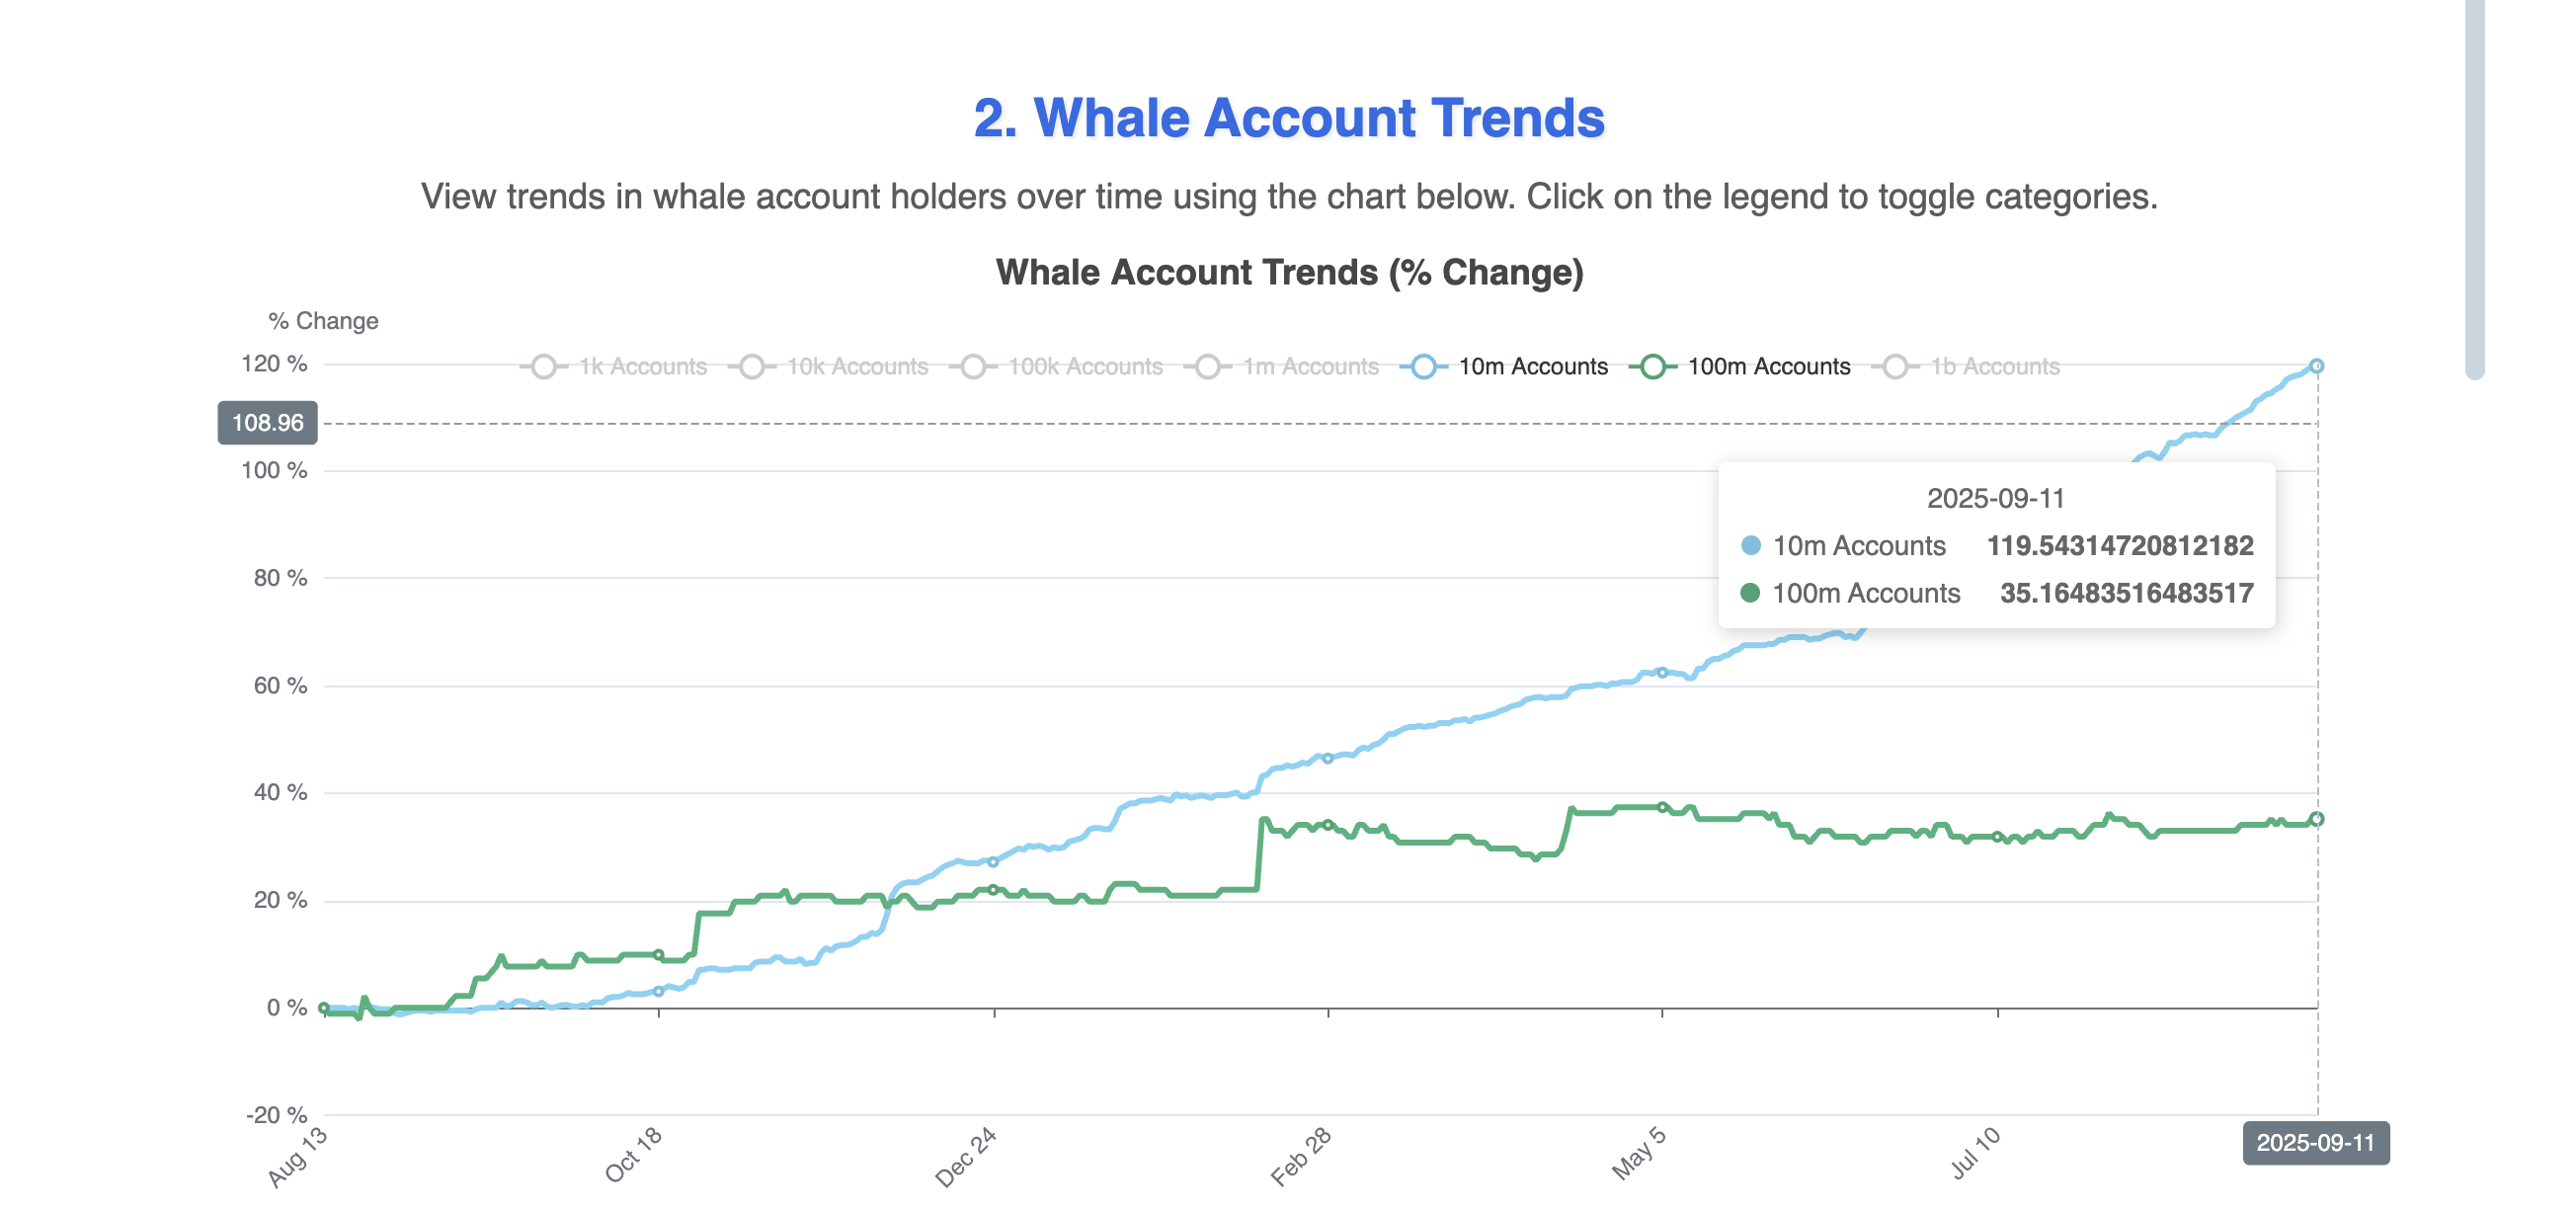
This translates to an addition of at least 18 million tokens. Furthermore, accounts holding 100 million or more HBAR rose from 34.06 to 35.16 during the same period, representing an accumulation of at least 110 million tokens. In total, whales absorbed at least 128 million HBAR, valued at over $30 million, within a week, indicating strong confidence in future price appreciation.
This accumulation coincides with a significant move on the Relative Strength Index (RSI). The RSI tracks buying and selling momentum, with higher readings indicating stronger upward pressure.
Since July, the RSI had been forming lower lows while HBAR’s price was making higher lows, creating a hidden bullish divergence – a signal that the broader uptrend may continue. This setup was confirmed on September 4–5 as the RSI turned upward with a price bounce. Shortly thereafter, whale accumulation intensified.
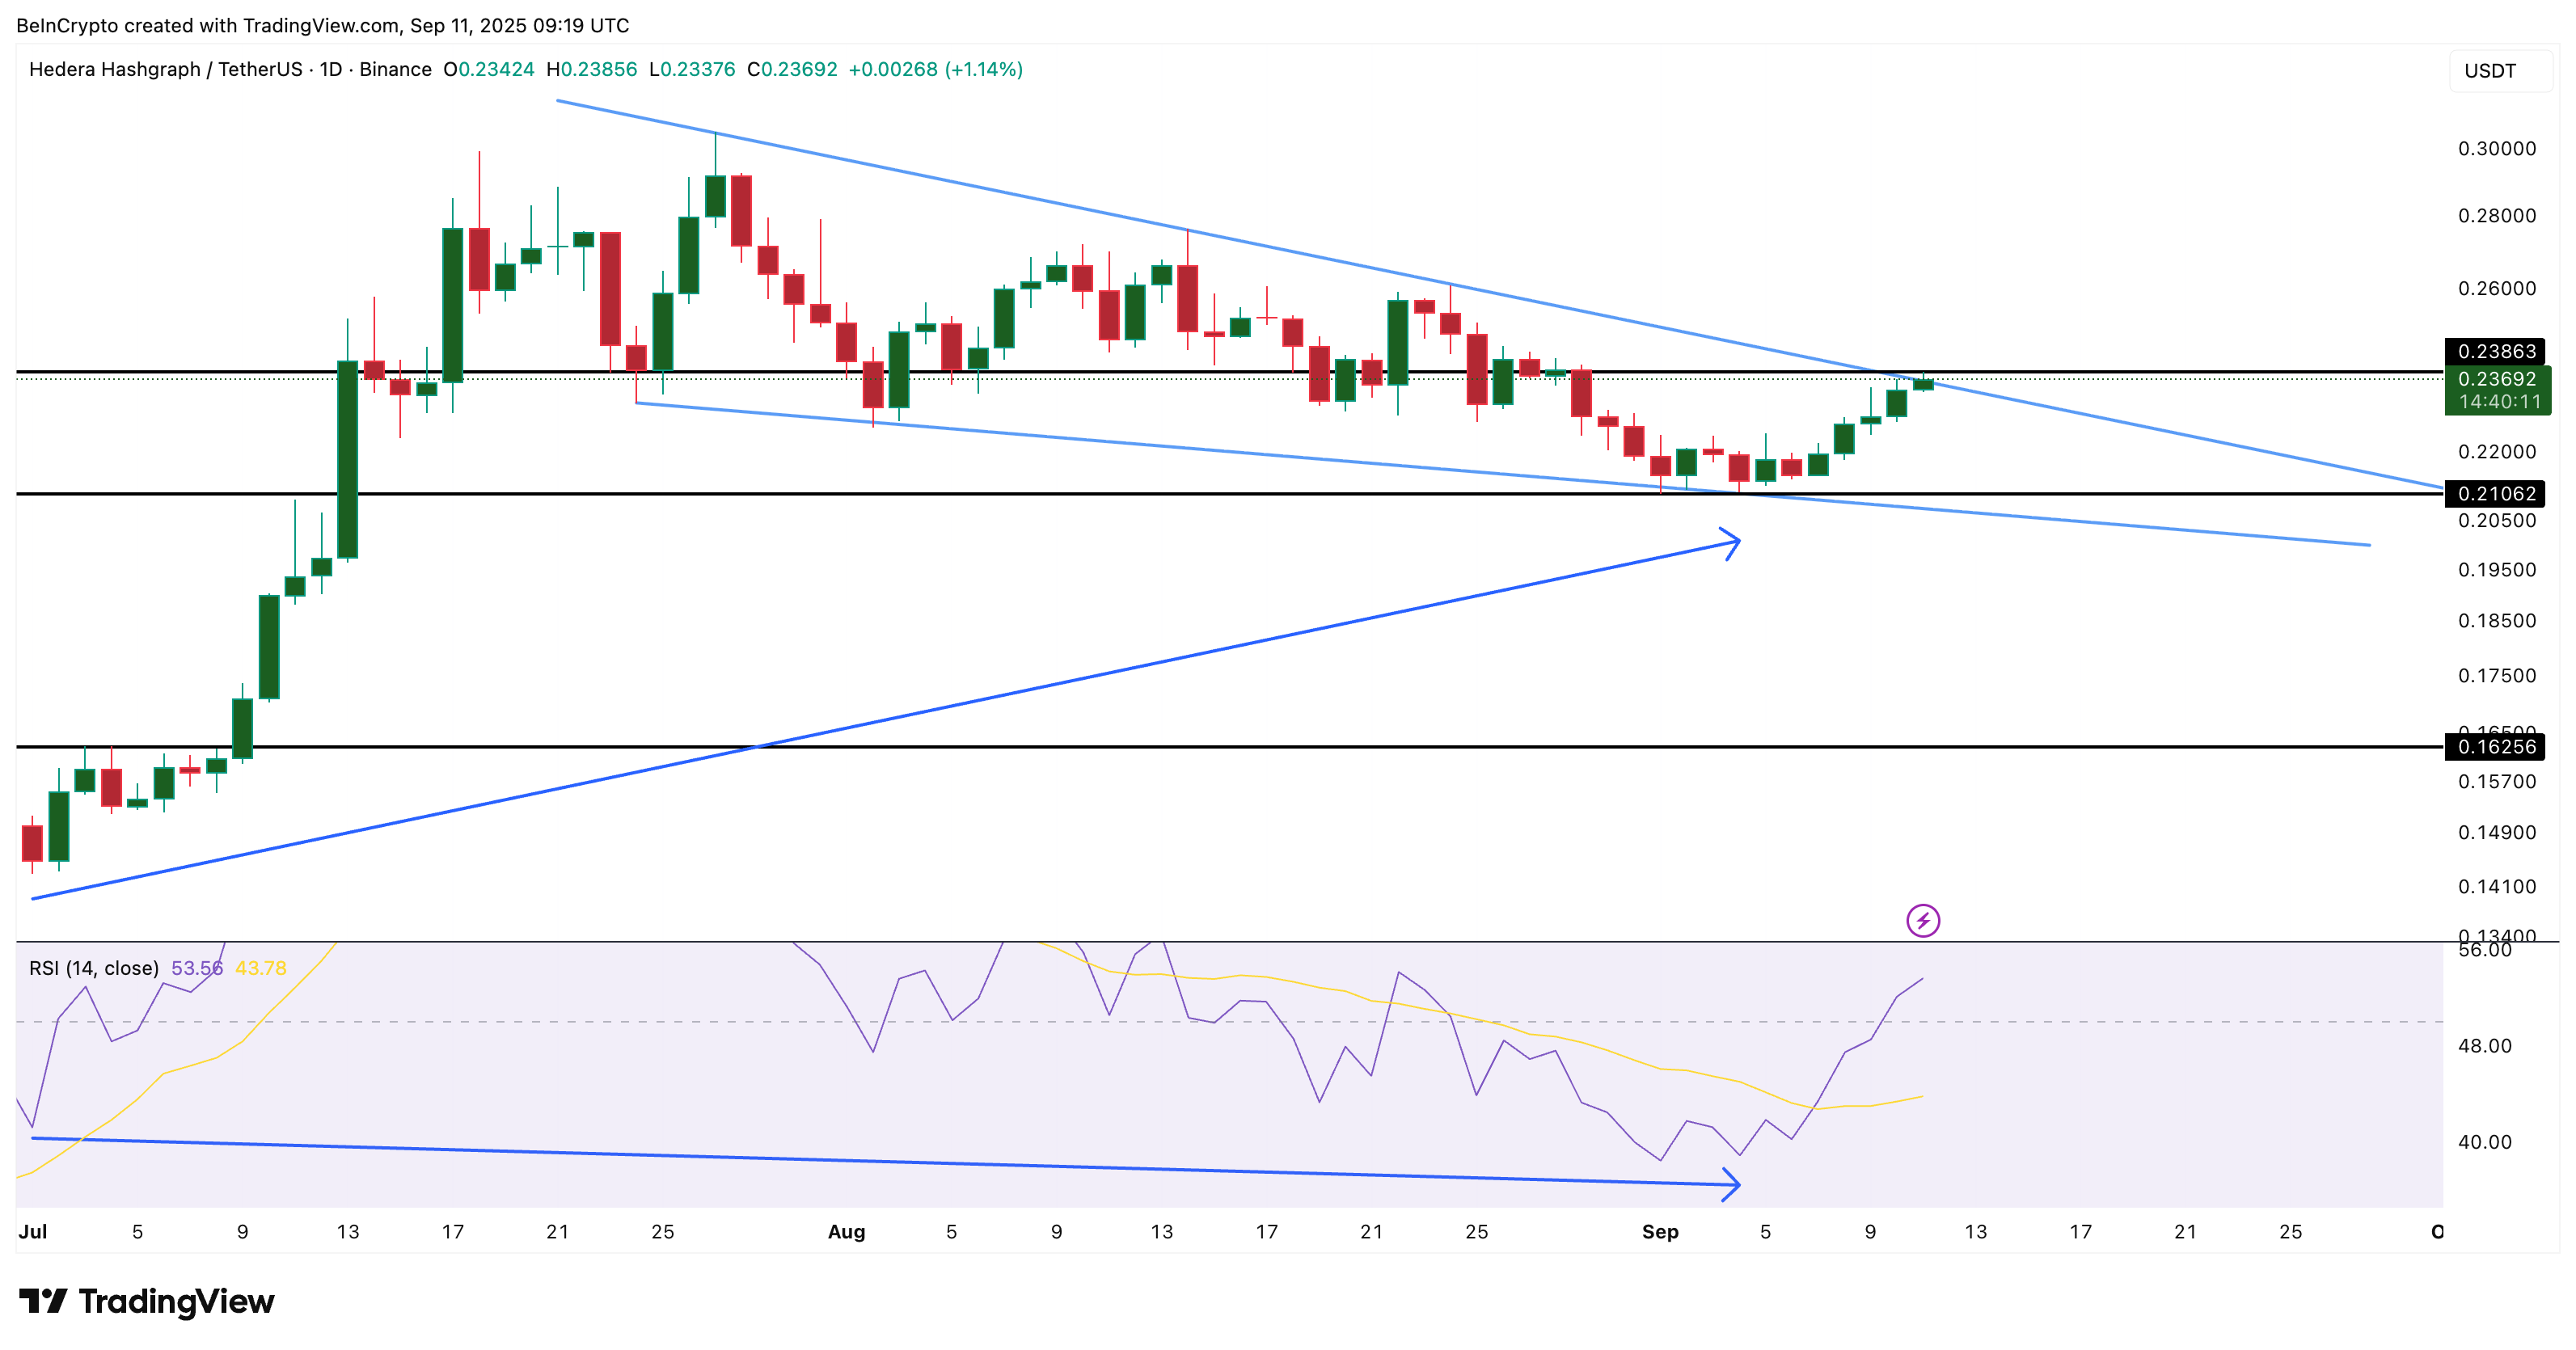
The combined effect has pushed HBAR toward the upper boundary of a falling wedge pattern. Falling wedges occur when prices form lower highs and lower lows within narrowing lines, typically resulting in an upward breakout.
To confirm this momentum, HBAR needs a daily close above $0.238, signaling that buyers are strong enough to control the trend.
HBAR Price Pattern Suggests Potential 40% Rally
Building on the RSI setup, the HBAR price chart reveals the potential for a substantial move. The falling wedge pattern suggests that a breakout could trigger significant upside.
The target for this move is determined by measuring the vertical distance between the wedge’s highest and lowest points (within the wedge) and projecting that distance upward from the breakout zone. For HBAR, this points to a target near $0.344, representing an approximate 40% rally from the breakout level.
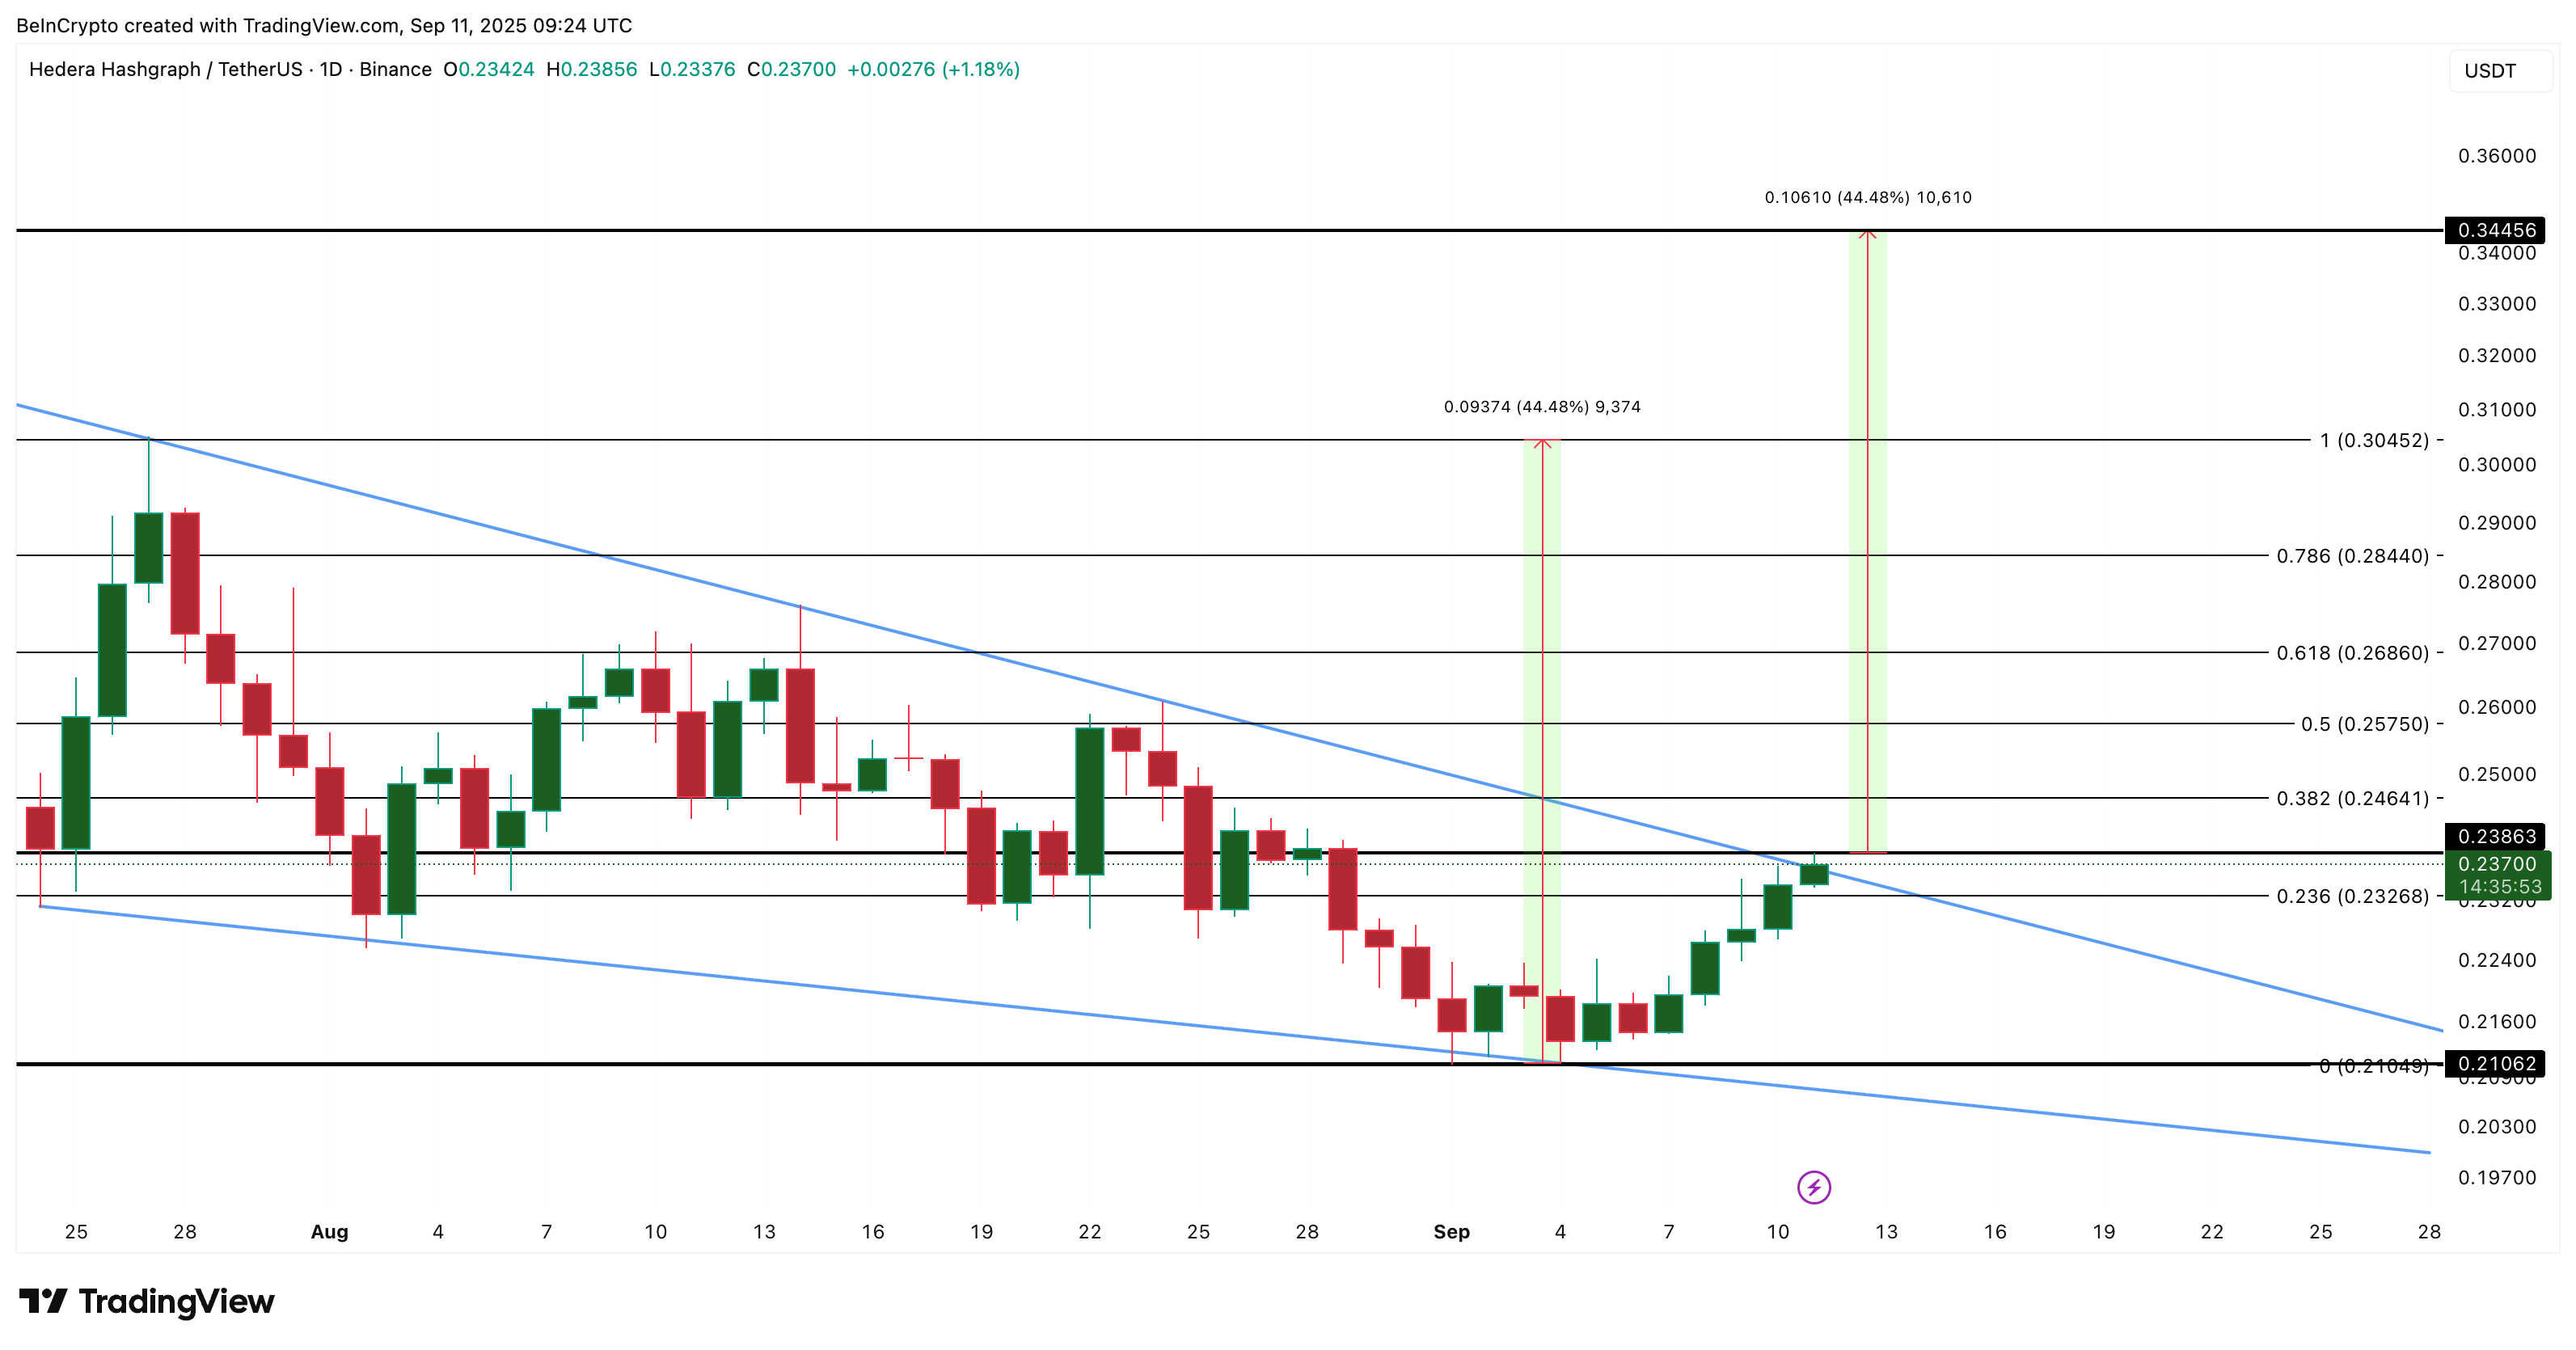
For this scenario to materialize, key levels must be surpassed in sequence. The first key resistance lies near $0.246, assuming the breakout above $0.238 is confirmed. Beyond that, $0.268 and $0.304 (a swing high) become critical checkpoints. Successfully breaking through these levels would pave the way for the full measured move towards $0.344.
Conversely, traders should also monitor for signs of failure. If the HBAR price falls below $0.232, the current bullish structure would weaken. A more significant drop below $0.210 would invalidate the wedge setup altogether, prompting a more cautious outlook.