HBAR Price Dip: Bearish Signals Emerge
HBAR Price Dips Amidst Bearish Sentiment
The Hedera Hashgraph (HBAR) token recently experienced a price decline, hitting a nine-day low. This downturn is attributed to decreased market activity, exacerbated by rising geopolitical tensions. The weakening sentiment has led to a surge in short positions, suggesting traders anticipate further price drops.
Bearish Indicators for HBAR
Coinglass data reveals a long/short ratio of 0.95 for HBAR, clearly indicating a dominant bearish bias. A ratio below 1 signifies more traders betting on a price decrease than an increase. This underscores a lack of confidence in any short-term price recovery.
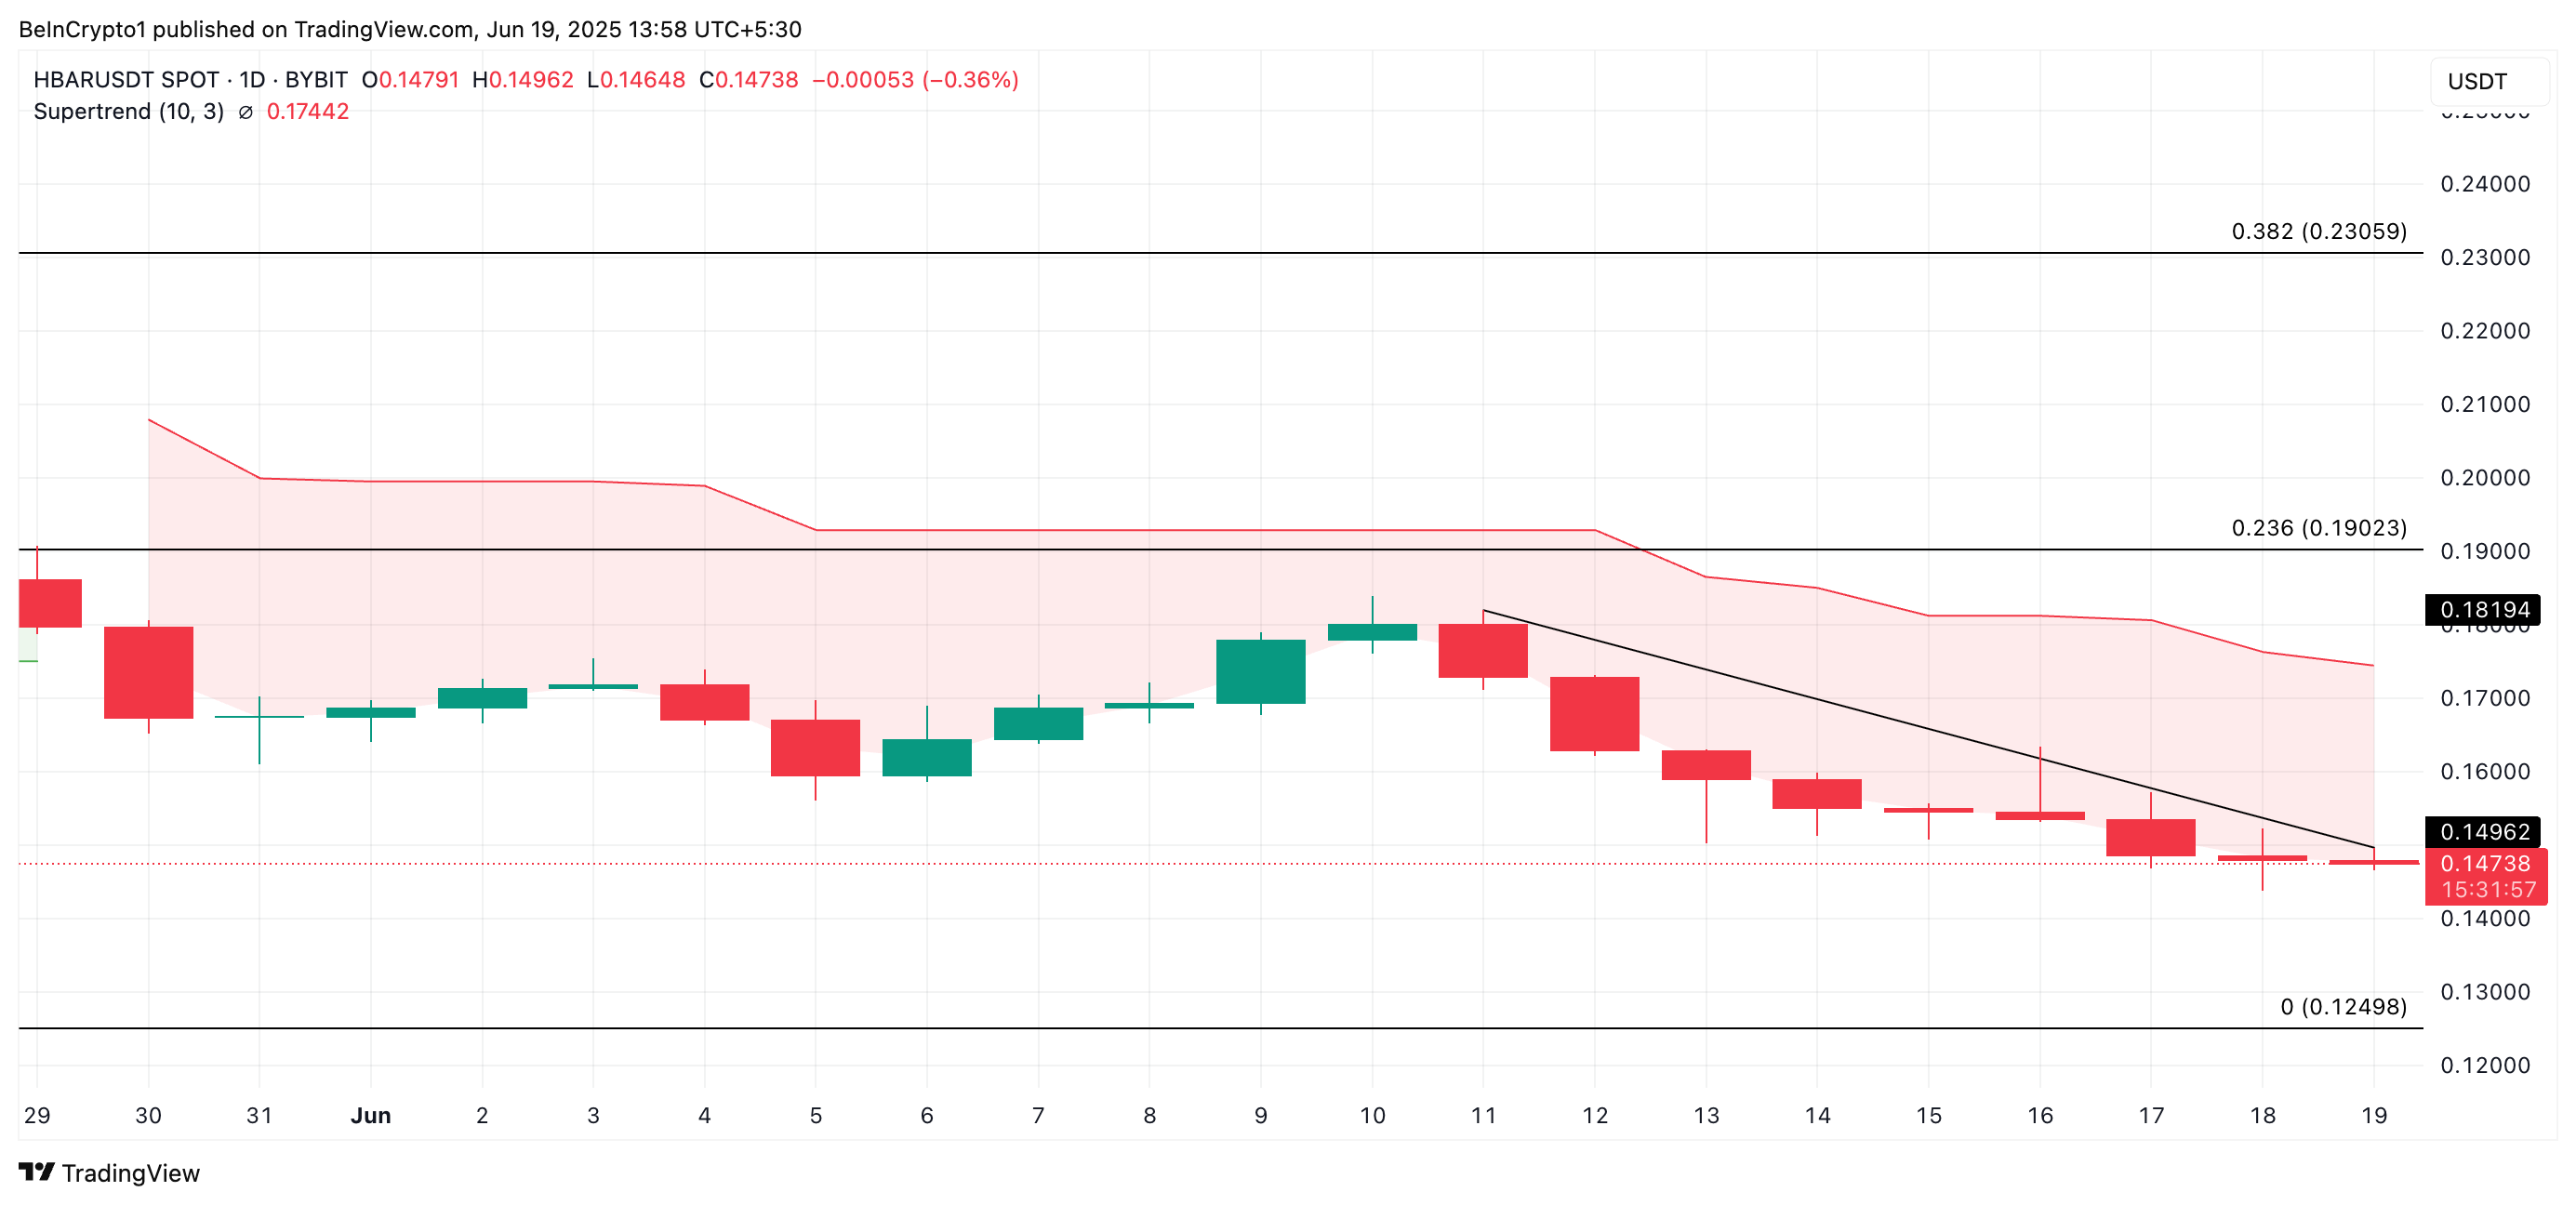
Further supporting this bearish outlook is HBAR's Super Trend line on the daily chart, currently acting as dynamic resistance around $0.14. When an asset's price trades below the Super Trend line, it typically indicates a downtrend.

The descending trend line observed over the past week also reinforces the bearish pressure. This pattern, formed by lower highs over time, points to persistent selling pressure.
Potential Future Price Movements
Trading at a ten-day low of $0.14, HBAR could potentially fall to $0.12, a level last seen in April, if buying pressure continues to weaken. Conversely, a resurgence in buying interest could push the price above the resistance formed by the descending trend line and Super Trend indicator, potentially reaching $0.19.
Disclaimer: This analysis is for informational purposes only and does not constitute financial advice. Market conditions are volatile. Conduct thorough research before making any investment decisions.
Codeum Note: Codeum offers comprehensive blockchain security solutions, including smart contract audits, tokenomics consulting, and custom DApp development, to help projects like Hedera mitigate risks and build robust, secure systems.