GRASS Price Surges 30% - What's Next?
The GRASS token has experienced a significant price increase, surging nearly 30% in the past week. Its market capitalization has climbed back to $415 million, with its price exceeding $1.70 for the first time since March 10. This rally warrants a closer look at the underlying technical indicators.
GRASS: Bullish Momentum and Potential Consolidation
While the recent price action is encouraging, a nuanced analysis is necessary. Bullish technical signals, including a positive BBTrend and a rising ADX, initially supported the rally. However, recent data suggests a potential shift.
BBTrend Analysis
GRASS's BBTrend (Bollinger Band Trend) is currently at 11.28, down slightly from its recent peak of 14.85. While still positive, indicating an uptrend, this slight decline warrants monitoring. A continued decrease might foreshadow consolidation or even a price reversal. Values above zero generally signify an uptrend; the higher the value, the stronger the bullish momentum.
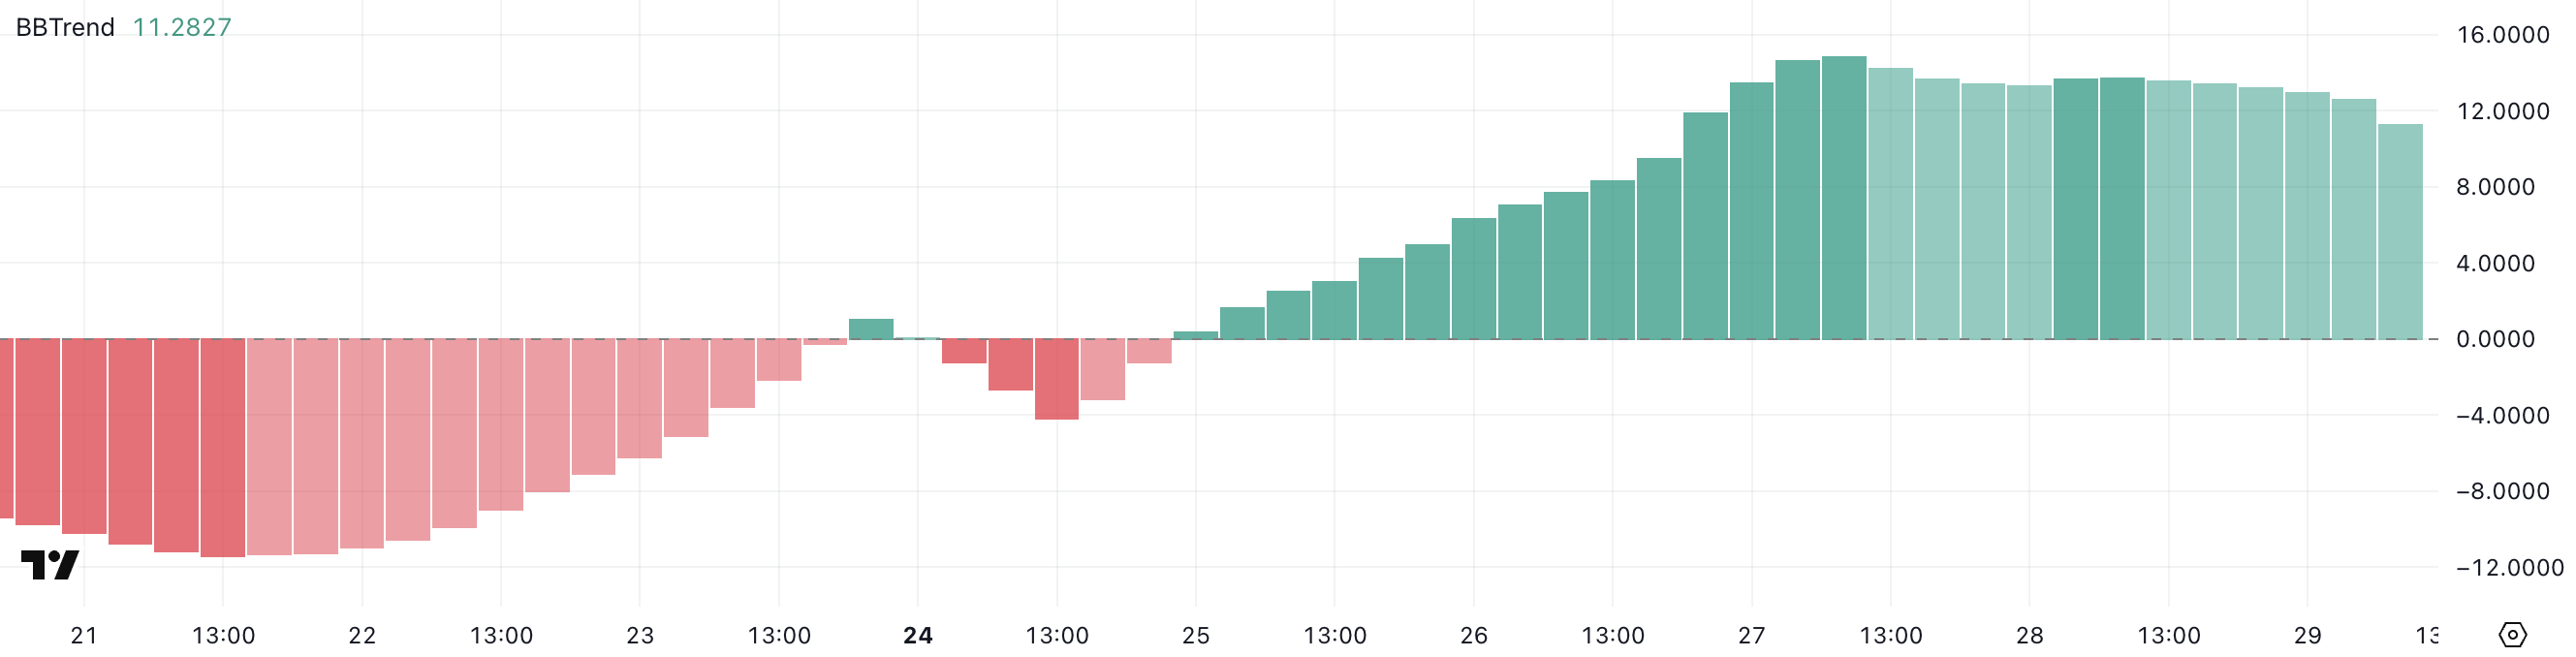
Source: TradingView
ADX Analysis
The Average Directional Index (ADX), a measure of trend strength, has risen to 30.31, up from 26.49 a day earlier. This indicates strengthening trend momentum. Readings above 25 generally suggest a trend gaining traction, and above 30 indicates a well-established trend. However, a plateau or decline in the ADX could signal a slowdown or consolidation.
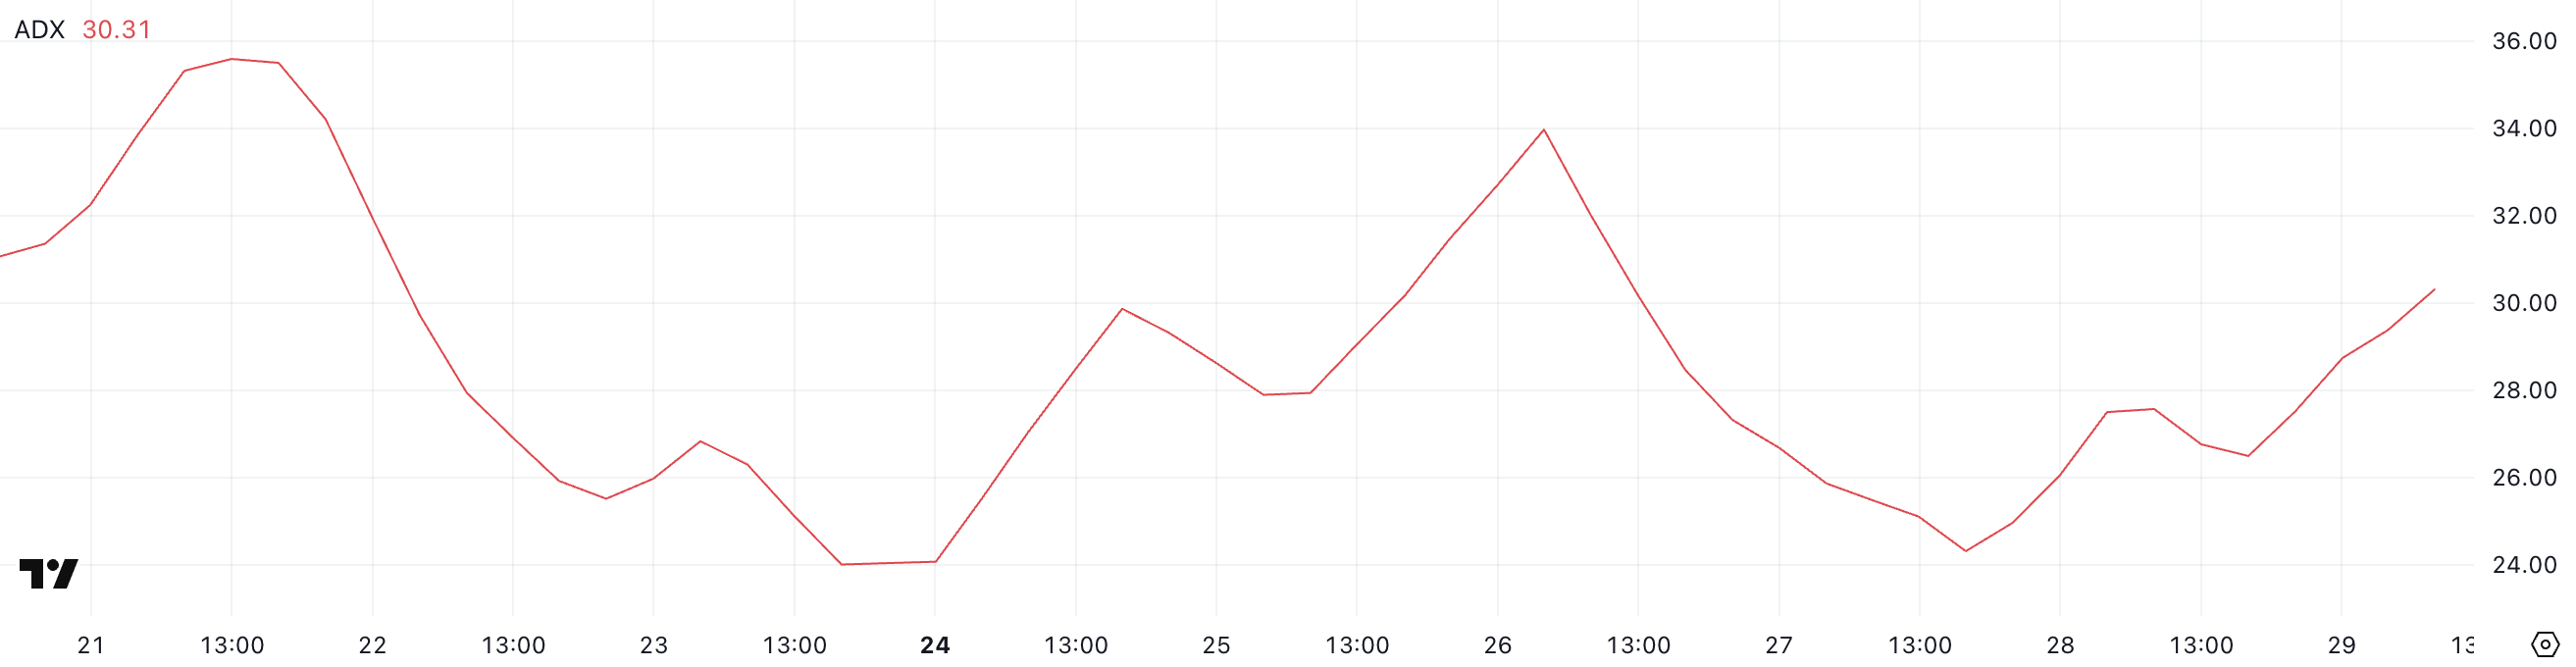
Source: TradingView
Potential Golden Cross and Future Price Predictions
The possibility of a golden cross—a bullish signal occurring when a short-term EMA crosses above a long-term EMA—is emerging. If confirmed, this could extend the uptrend. GRASS might test immediate resistance at $1.85. Sustained bullish momentum could push the price towards $2.26, $2.56, or even $2.79. Conversely, a bearish shift could lead to a retest of support at $1.63, or even a deeper correction to $1.22.
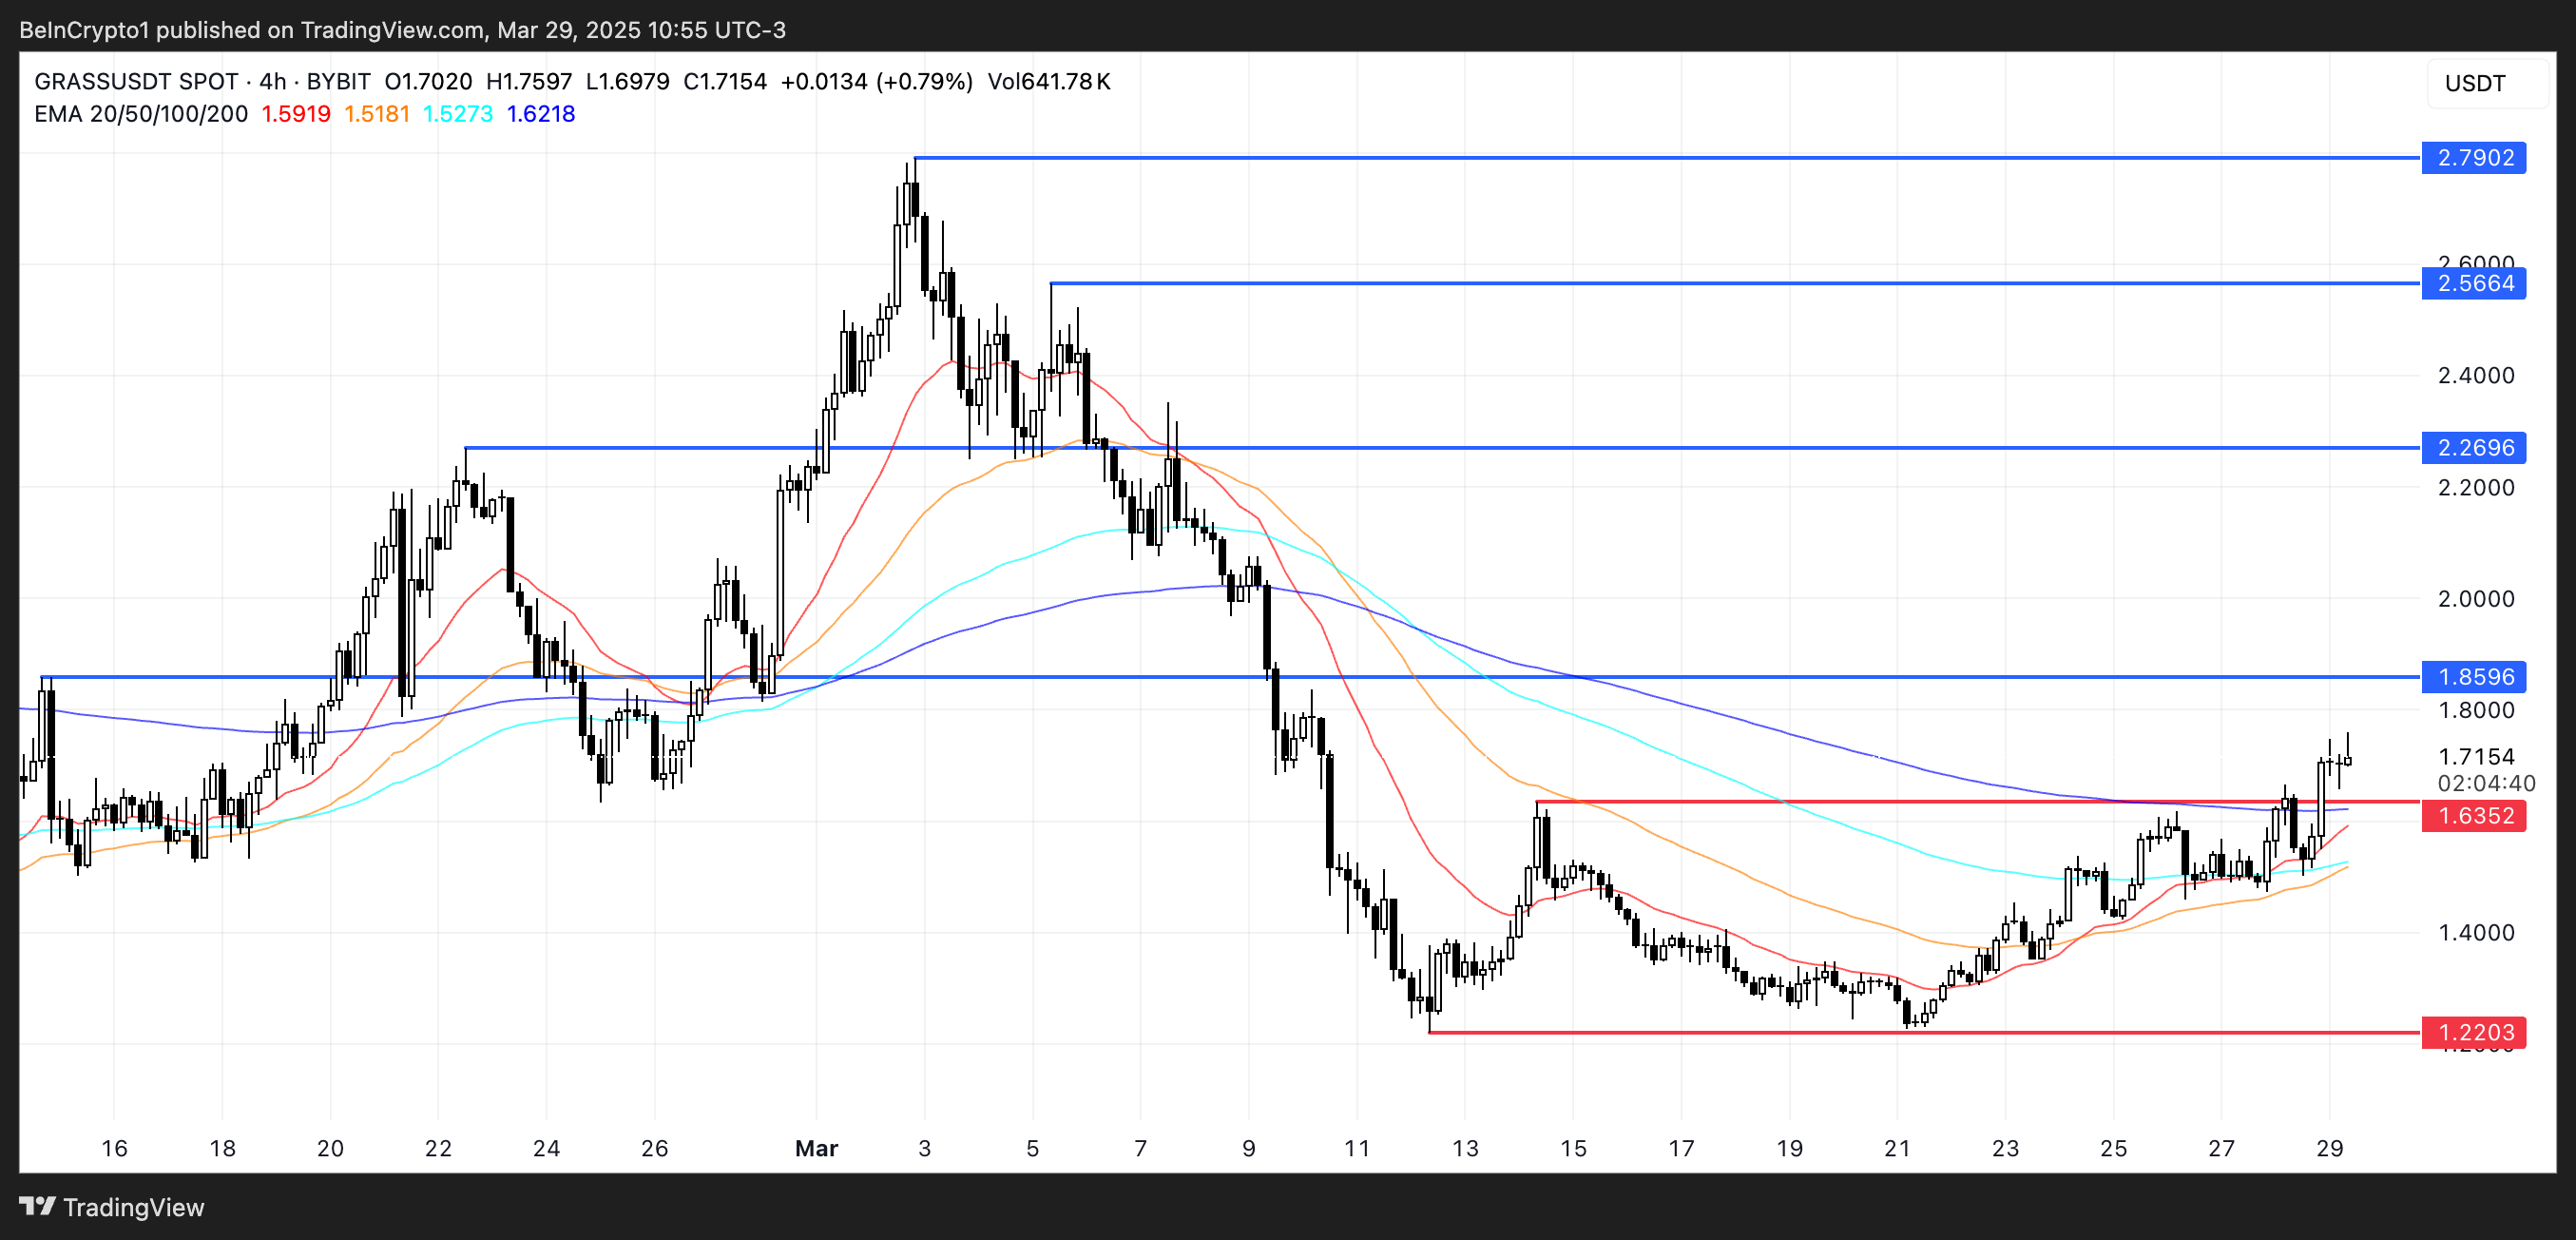
Source: TradingView
Disclaimer: This analysis is for informational purposes only and does not constitute financial advice. Conduct thorough research before making any investment decisions.