Berachain (BERA) Price Correction After Rally
Berachain (BERA) Price Correction After Rally
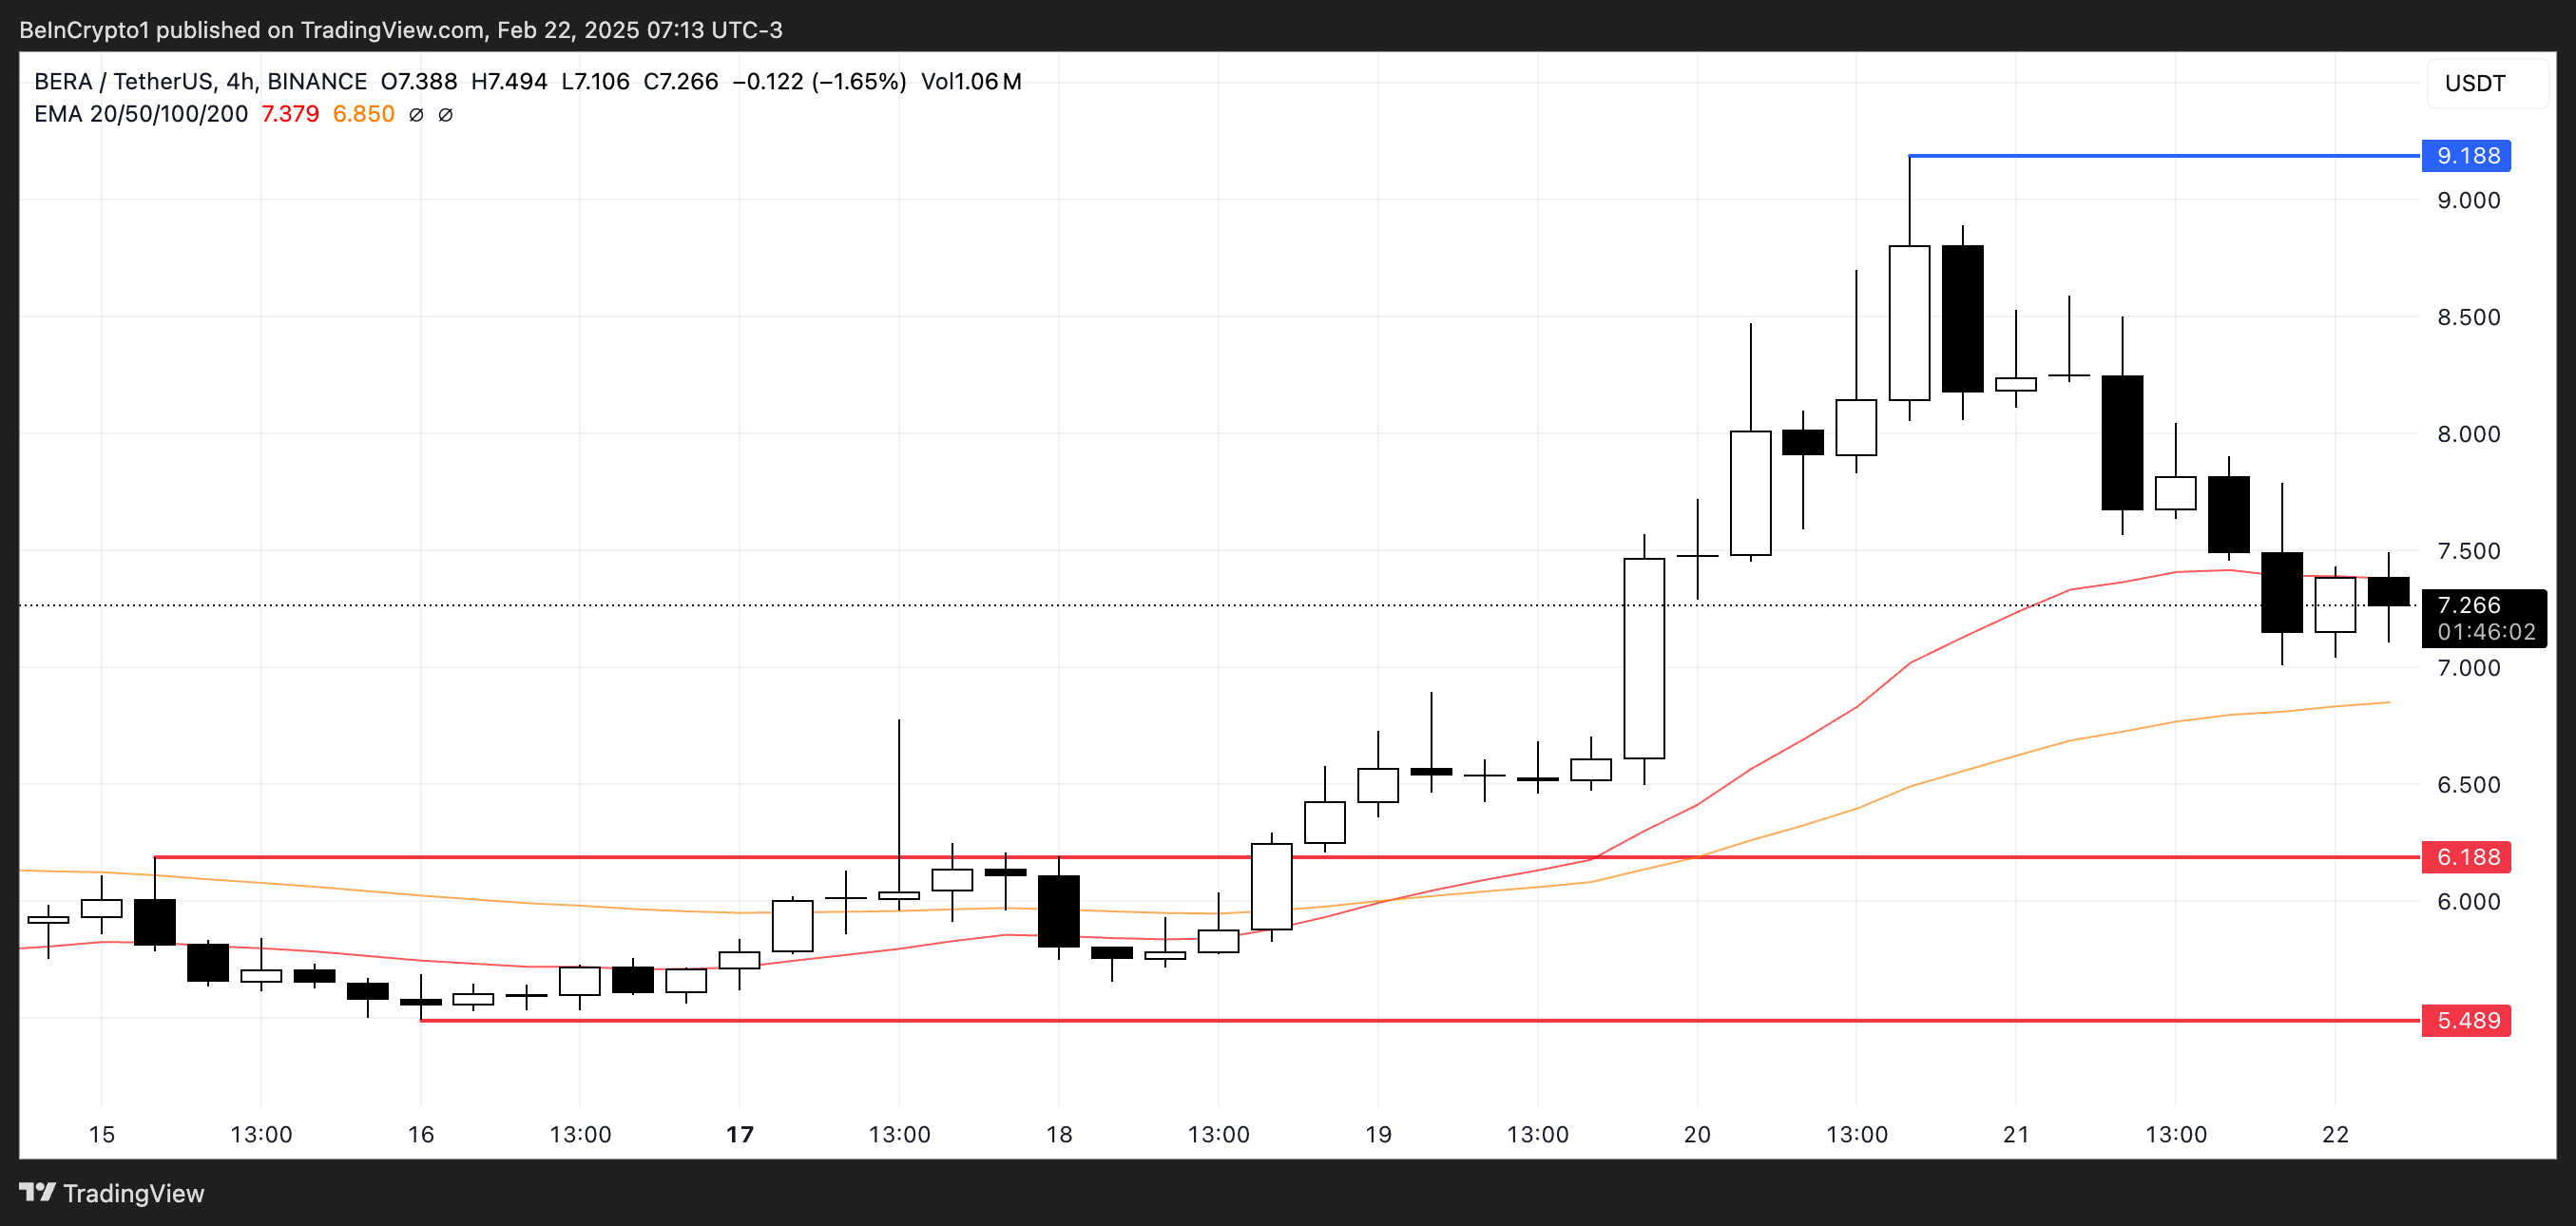
Berachain (BERA) saw a significant price correction, dropping almost 15% in the last 24 hours. Its market capitalization is now at $778 million, though it remains up nearly 20% over the past seven days. This pullback follows a strong rally between February 18th and 20th, when BERA reached highs above $8.5.
Technical indicators suggest a shift in momentum. The Relative Strength Index (RSI) has fallen from overbought levels, signaling a loss of bullish momentum. The Directional Movement Index (DMI) indicates growing bearish pressure. Key support for BERA sits at $6.1, with resistance levels at $8.5, $9.1, and $10 if bullish momentum returns.
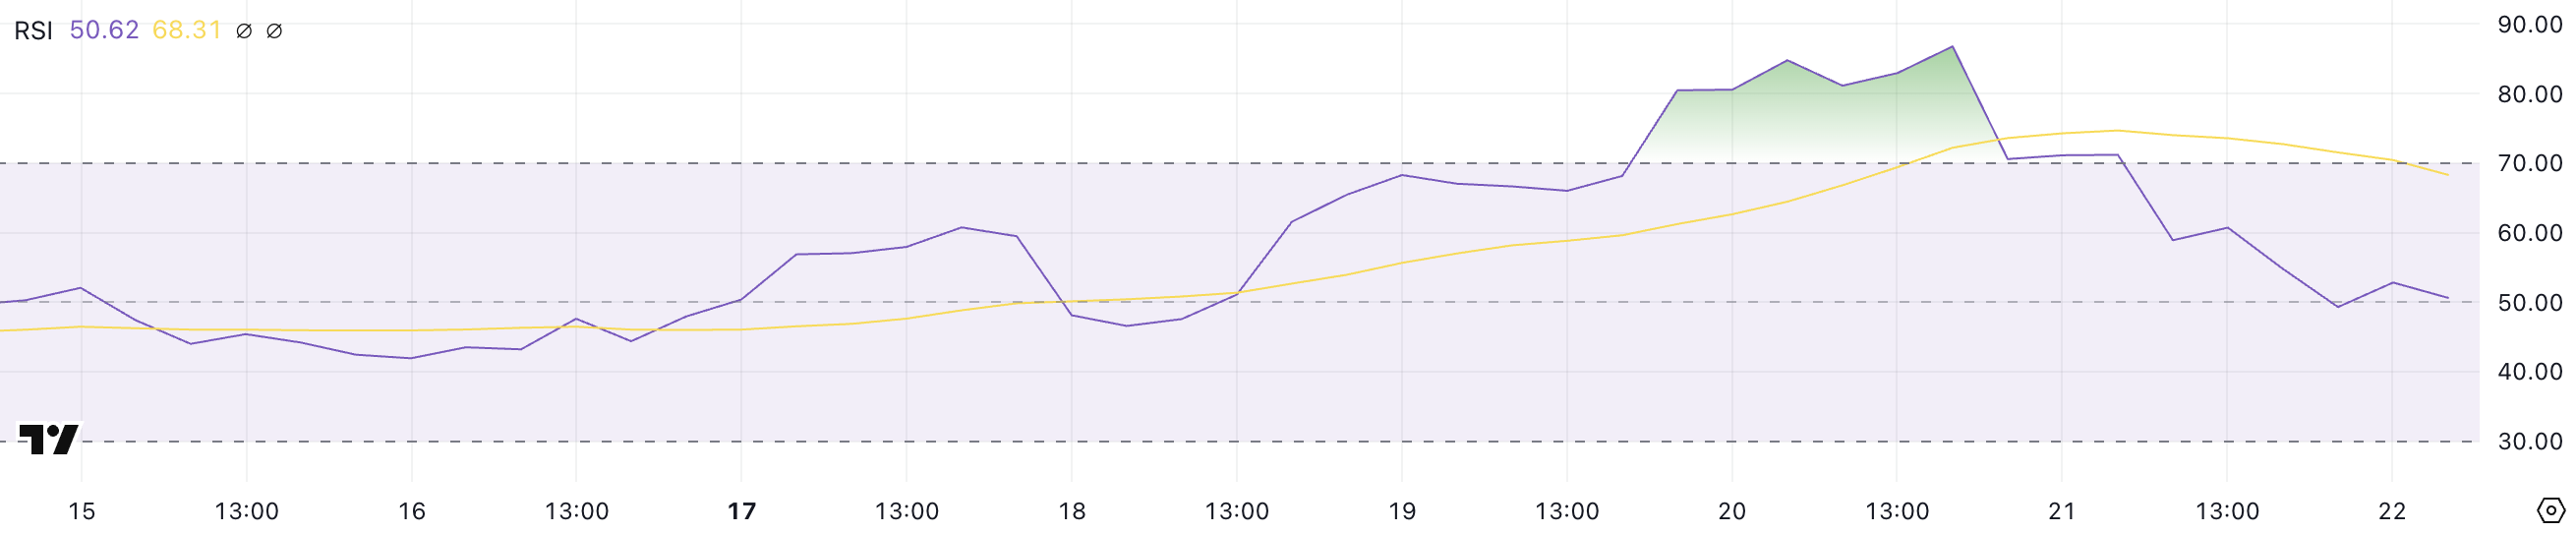
BERA RSI: A Loss of Bullish Momentum
Berachain's RSI is currently at 50.6, a sharp decline from 86.7 just two days prior. The RSI, a momentum oscillator, measures the speed and change of price movements (0-100). Readings above 70 suggest overbought conditions, and below 30 indicate oversold conditions. The drop in BERA's RSI reflects a substantial loss of bullish momentum after reaching overbought territory.
With the RSI now in a neutral zone (around 50), buying and selling pressures appear balanced. This could signal a period of consolidation. Further decline below 50 could signal increasing bearish momentum, while stabilization and a rise could suggest renewed buying interest.
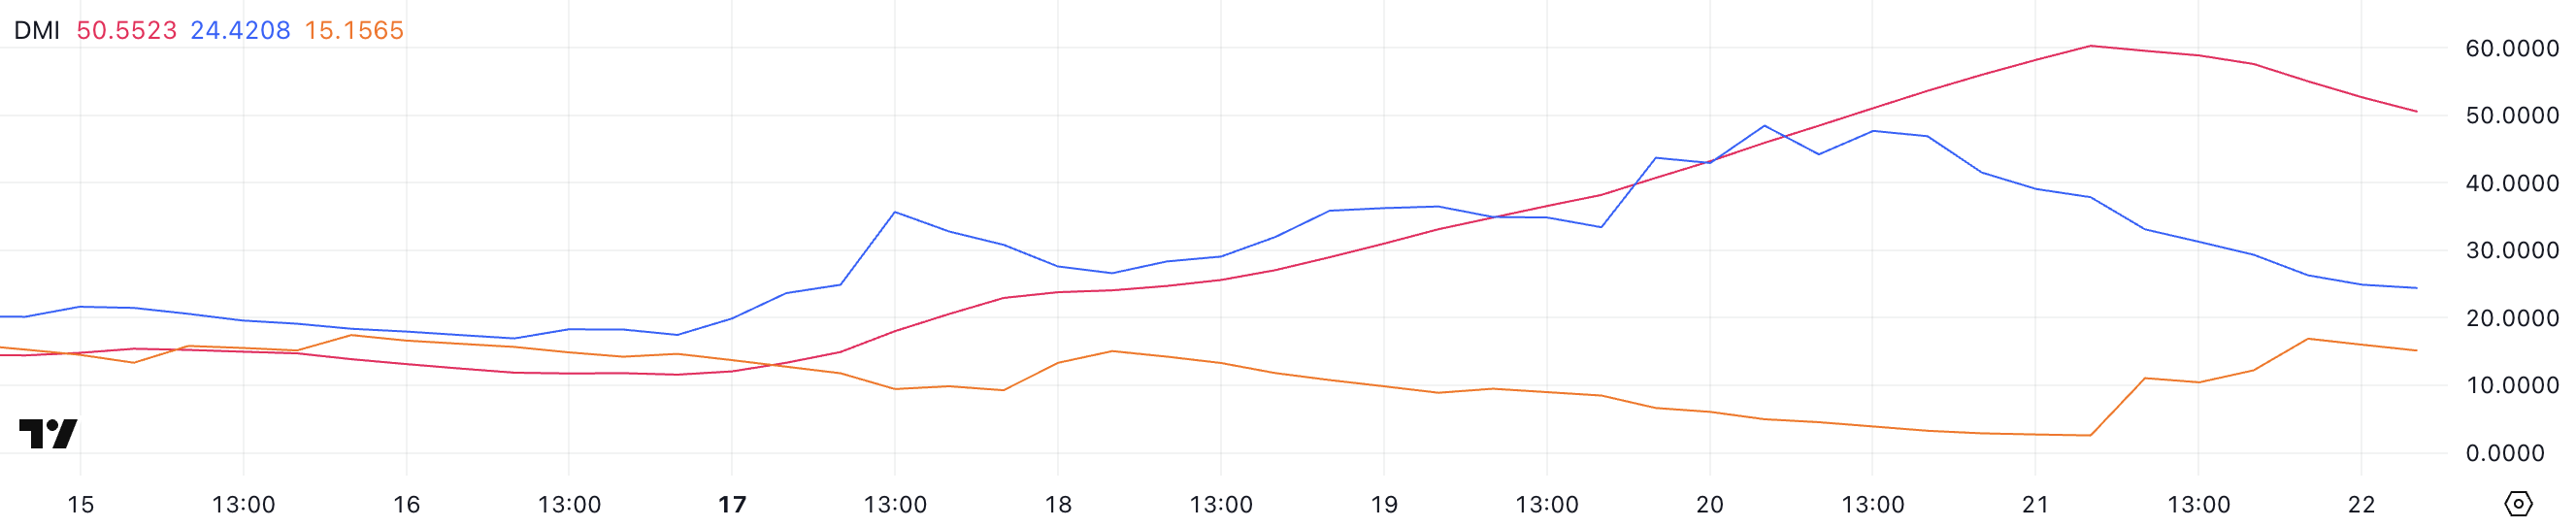
BERA DMI: Buyers Losing Control
The Berachain Directional Movement Index (DMI) shows an Average Directional Index (ADX) of 50.5, down from a peak of 60.2 the previous day. The ADX measures trend strength (0-100). Values above 25 typically indicate a strong trend, while values below 20 suggest a weak or sideways market. The recent rise in ADX confirmed strong directional movement, but the current decline signals waning momentum.
BERA's +DI (positive directional indicator) is at 24.4, down from 48.4, indicating weakening bullish momentum. Conversely, -DI (negative directional indicator) has risen to 15.1 from 4.9, suggesting growing bearish pressure. A bearish crossover (-DI above +DI) could signal a price reversal or deeper correction.
Will Berachain Fall Below $6?
Berachain's 53% surge between February 18th and 20th pushed its price above $8.5. However, the current correction has the potential to test support at $6.1. A break below this level could lead to further decline. Conversely, renewed buying pressure could see BERA test resistance levels at $8.5, $9.1, or even $10.
Disclaimer: This analysis is for informational purposes only and should not be considered financial or investment advice. Market conditions change rapidly. Conduct your own research and consult a professional before making financial decisions.