Is PEPE price primed for rebound? TD sequential signals big move ahead!
- PEPE hits $2.6 billion trading volume as technical signals indicate potential bullish breakout opportunities.
- 73.6% of PEPE holders are in profit, with key resistance at $0.000022 and strong support at $0.000013.
The crypto market has experienced mixed trends over the past two weeks, with a sharp shift from bullish sentiment to bearish caution. Among the affected assets, meme coins like Pepe [PEPE] have seen reduced trading interest as attention returns to Bitcoin [BTC].
Despite this, technical indicators suggest PEPE could be poised for a rebound as trading volume reaches $2.6 billion.
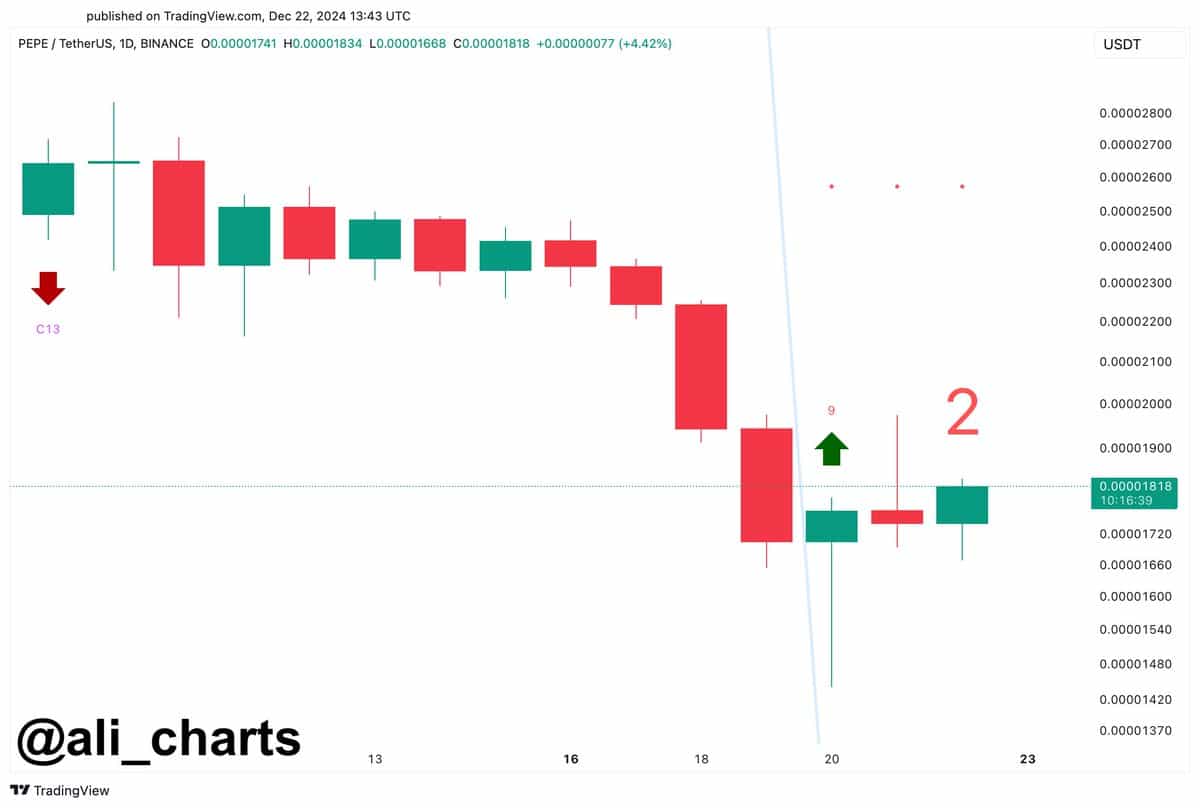
TD sequential buy signal indicates potential rebound
Technical analysis tools are signaling a potential turnaround for PEPE. The TD Sequential indicator has presented a buy signal on the daily chart, commonly interpreted as a sign of an upcoming price reversal.
Such signals in the past have often preceded upward price movements, making it a focal point for traders anticipating a rebound.


Source: X
PEPE was trading at $0.00001791 at press time, showing a 2% price increase in the last 24 hours but remains down 25.97% over the past seven days.
With its price range fluctuating between $0.00001455 and $0.0000242 in the past week, traders are closely watching resistance near $0.00002201, where Bollinger Bands also signal key levels to break for a sustained rally.
Whale activity slows after November spike
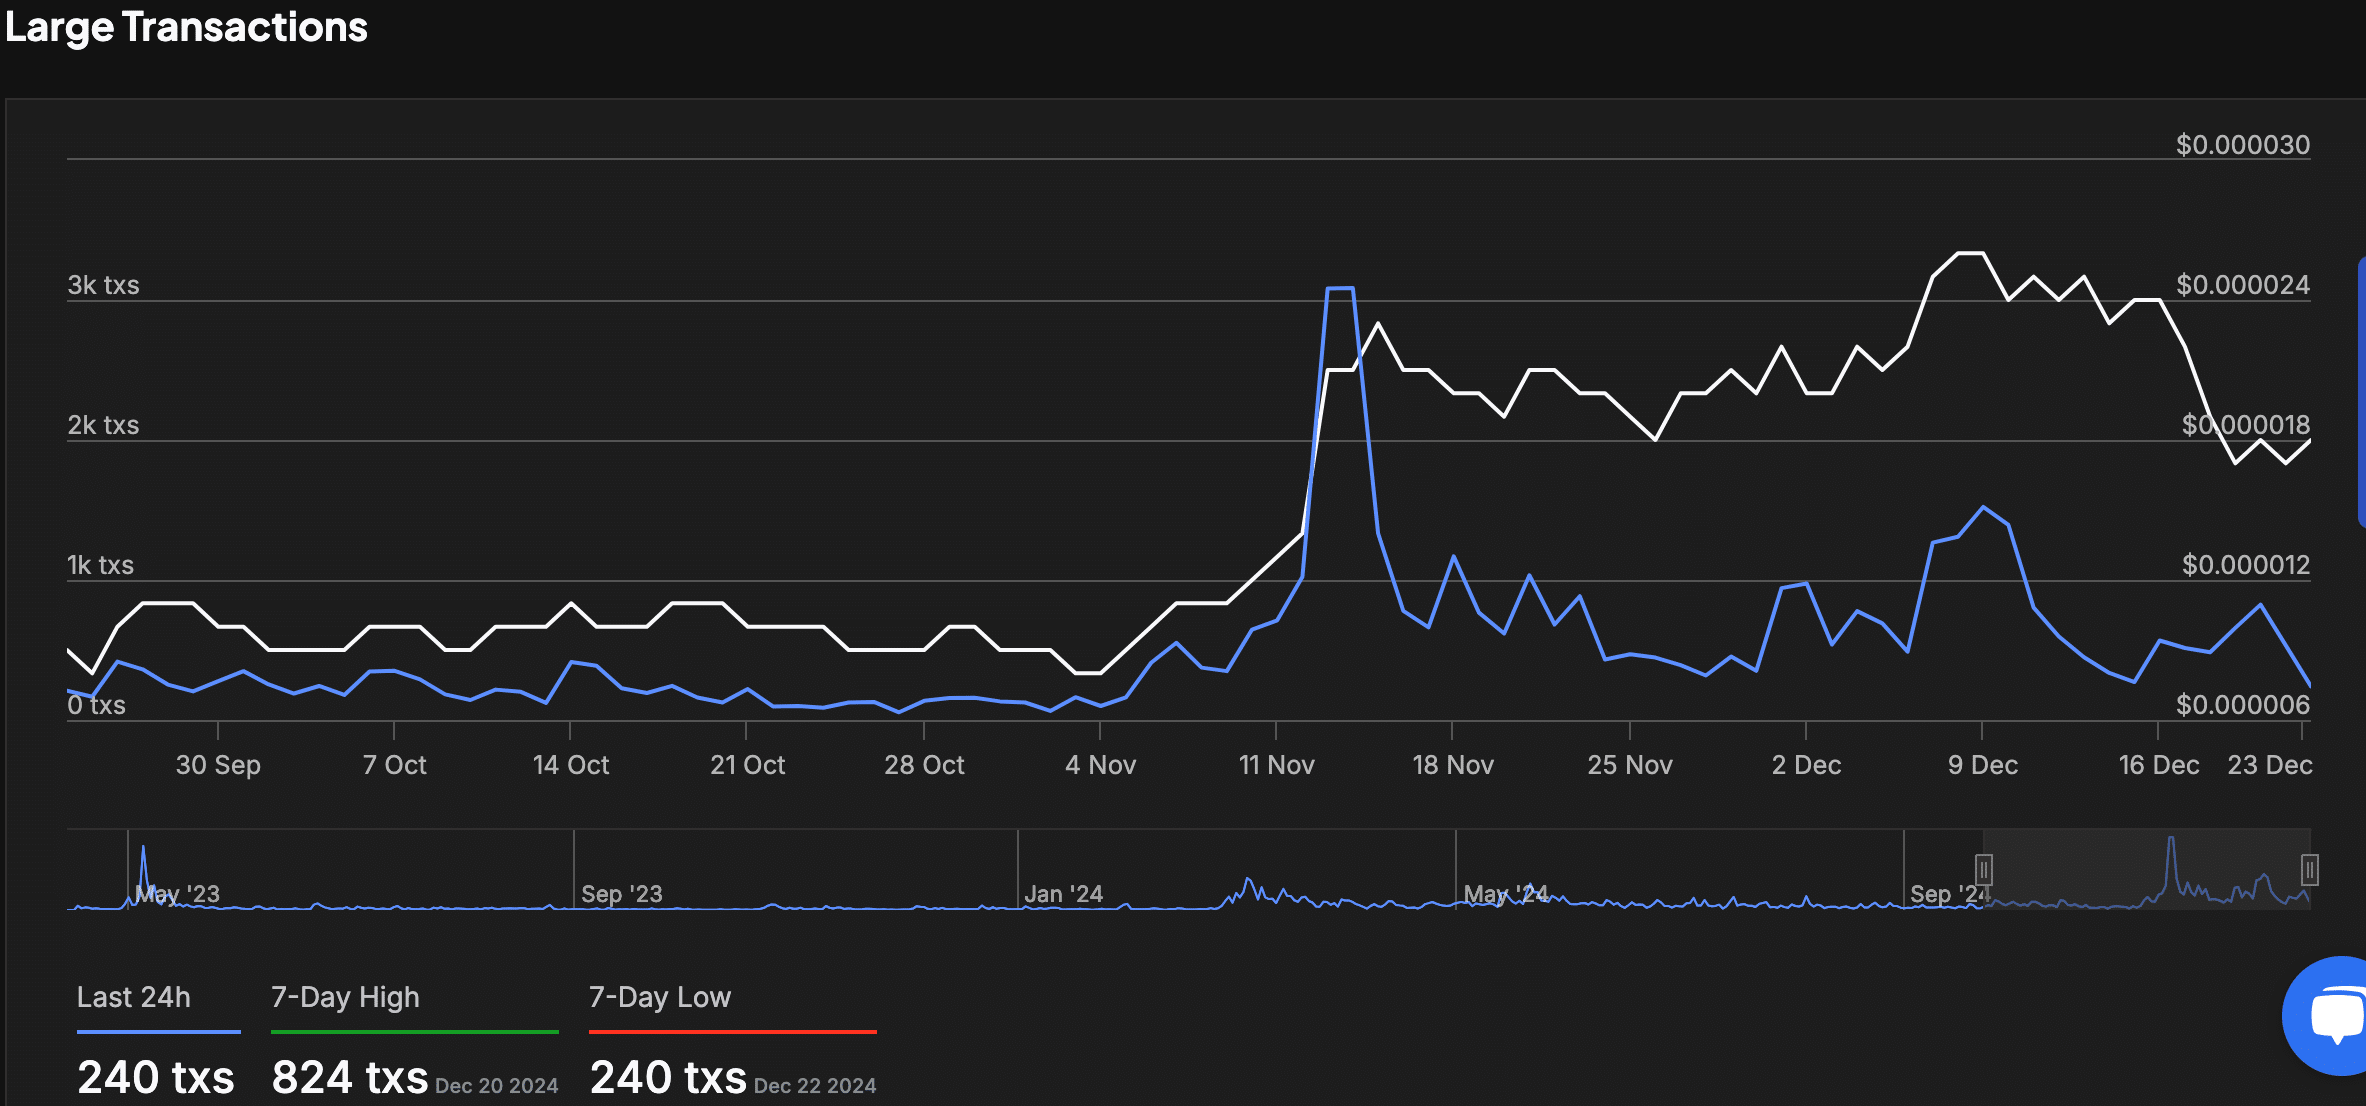
Data from IntoTheBlock reveals a marked decline in large transaction activity for PEPE. Mid-November saw a spike in large transactions as the price reached $0.000024, hinting at whale or institutional activity.
Since then, transactions have dropped, with only 240 large transactions recorded in the past 24 hours, the lowest in the last week.


Source: IntoTheBlock
The reduced activity aligns with the price’s consolidation around $0.00001791, suggesting that accumulation or reduced trading interest is occurring.
Analysts indicate that monitoring large transaction activity could provide insights into any potential breakout or further downward movement.
On-chain metrics suggest critical price zones
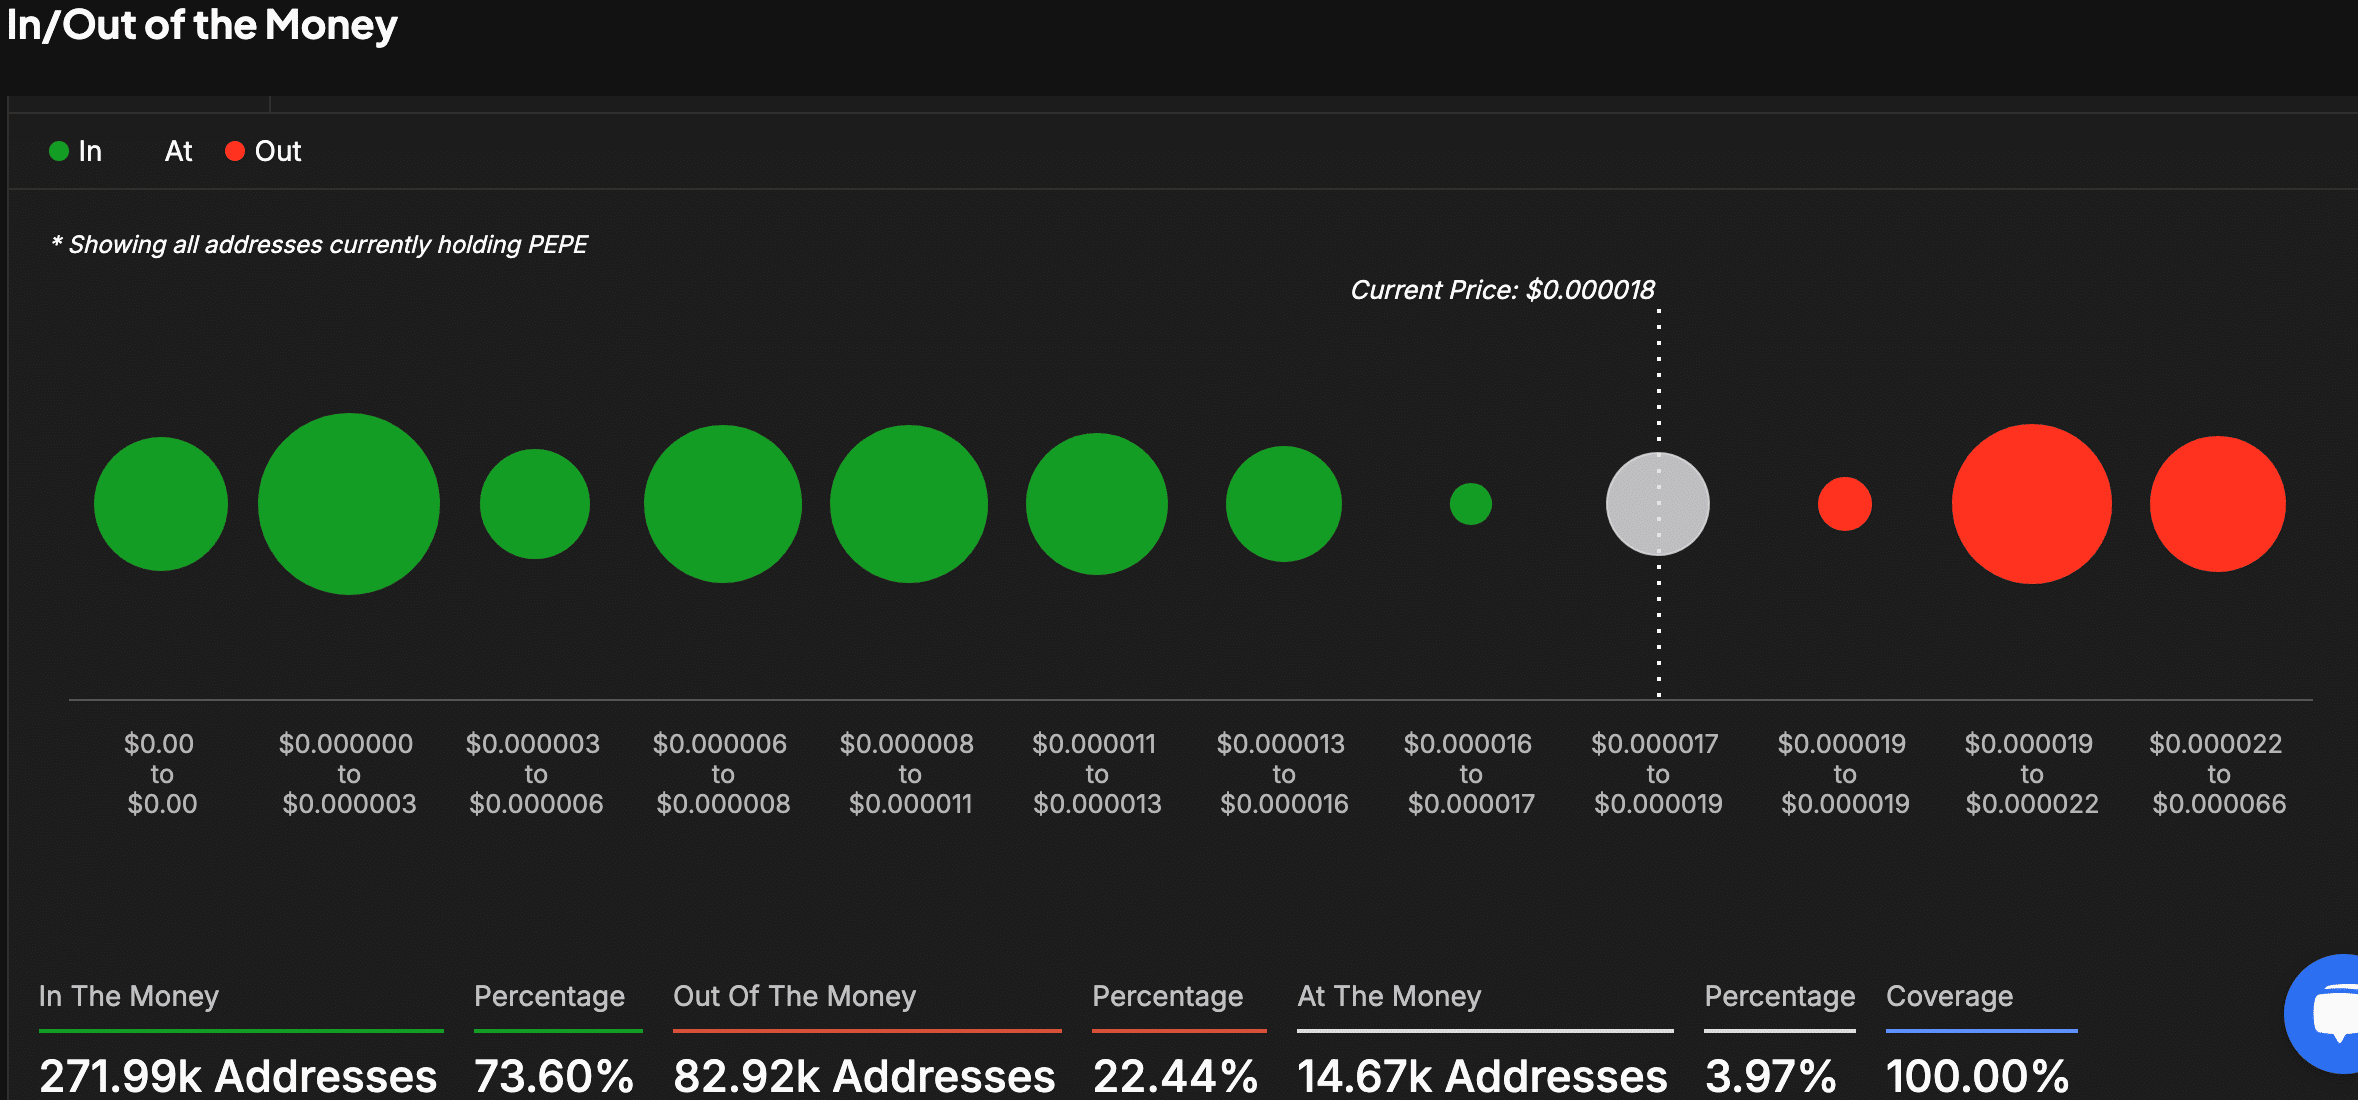
On-chain analysis shows 73.60% of PEPE wallets are profitable, with strong support established between $0.000011 and $0.000013, where most holders accumulated the token.
However, approximately 22.44% of wallets remain unprofitable, with potential resistance expected between $0.000019 and $0.000022, as these holders may sell to recoup losses.


Source: IntoTheBlock
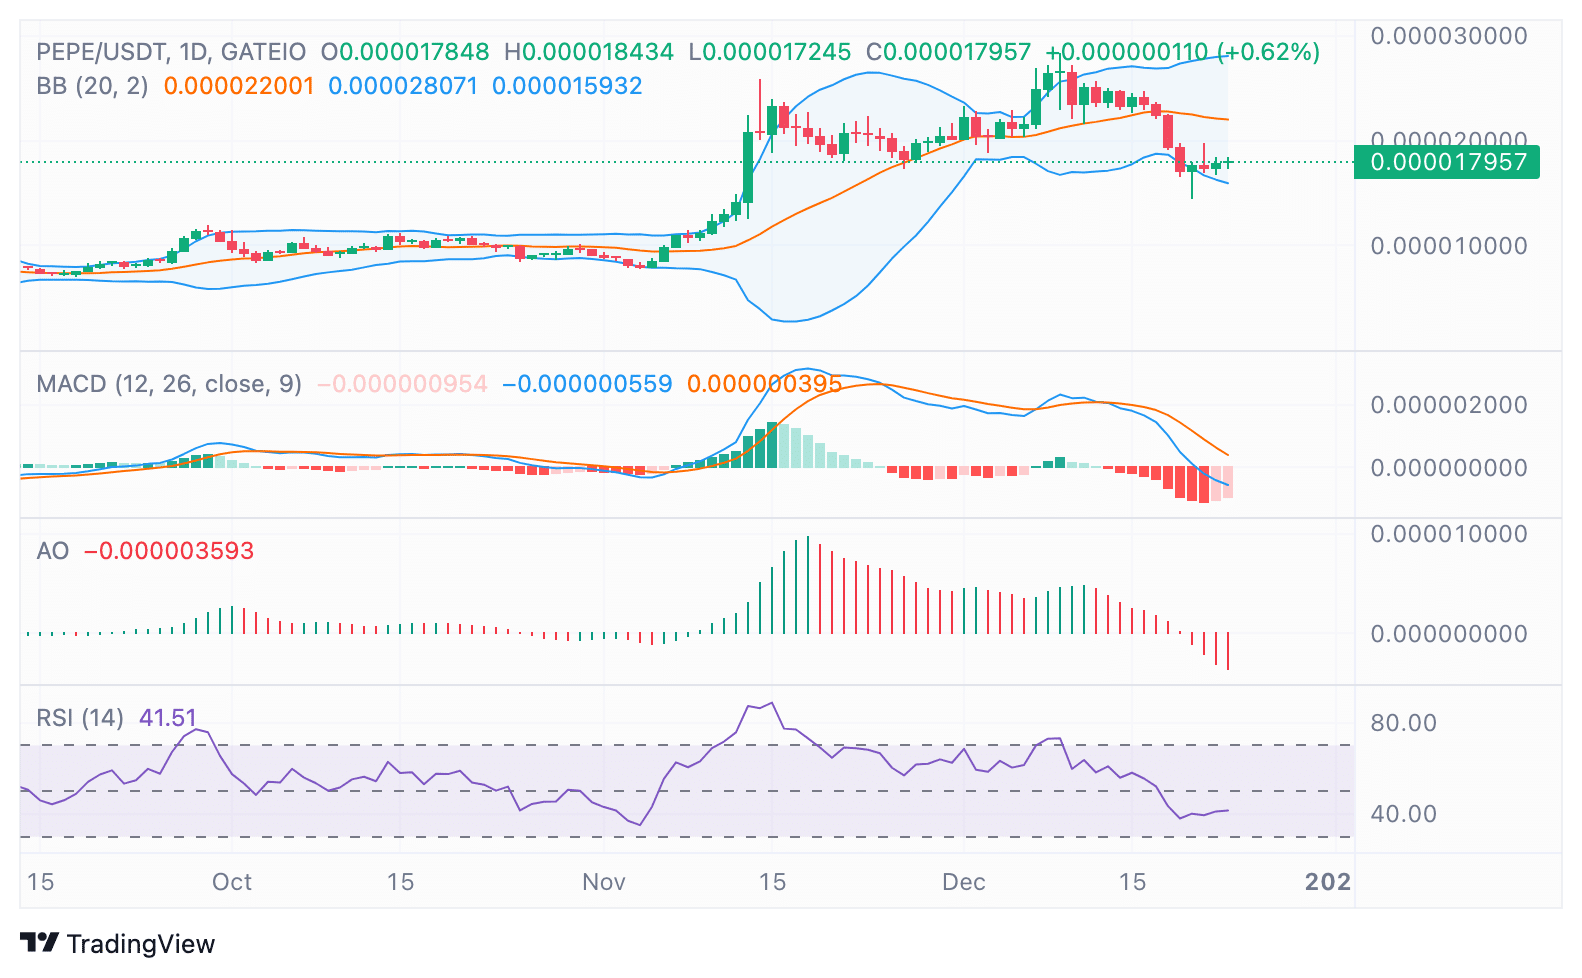
Bollinger Bands further highlight critical levels, with the lower band at $0.00001593 acting as a support zone and the upper band at $0.00002201 signaling resistance.
A break above the upper band could catalyze upward momentum, while a drop below the lower band may lead to further price corrections.
Indicators show weakening bearish momentum
Momentum indicators suggest that the downtrend could be weakening. The MACD histogram shows contraction, pointing toward a potential bullish crossover.
Read Pepe’s [PEPE] Price Prediction 2024–2025
Meanwhile, the RSI currently sits at 41.51, below the neutral 50 level but not in oversold territory. A move above 50 could signal renewed buying interest.


Source: TradingView
As the market stabilizes, the combination of a TD Sequential buy signal, on-chain metrics, and technical indicators suggests that PEPE may be preparing for its next move.
Source link