Here’s Why Bitcoin Price Could Set Its Next Jump to $22000?

Published 2 hours ago
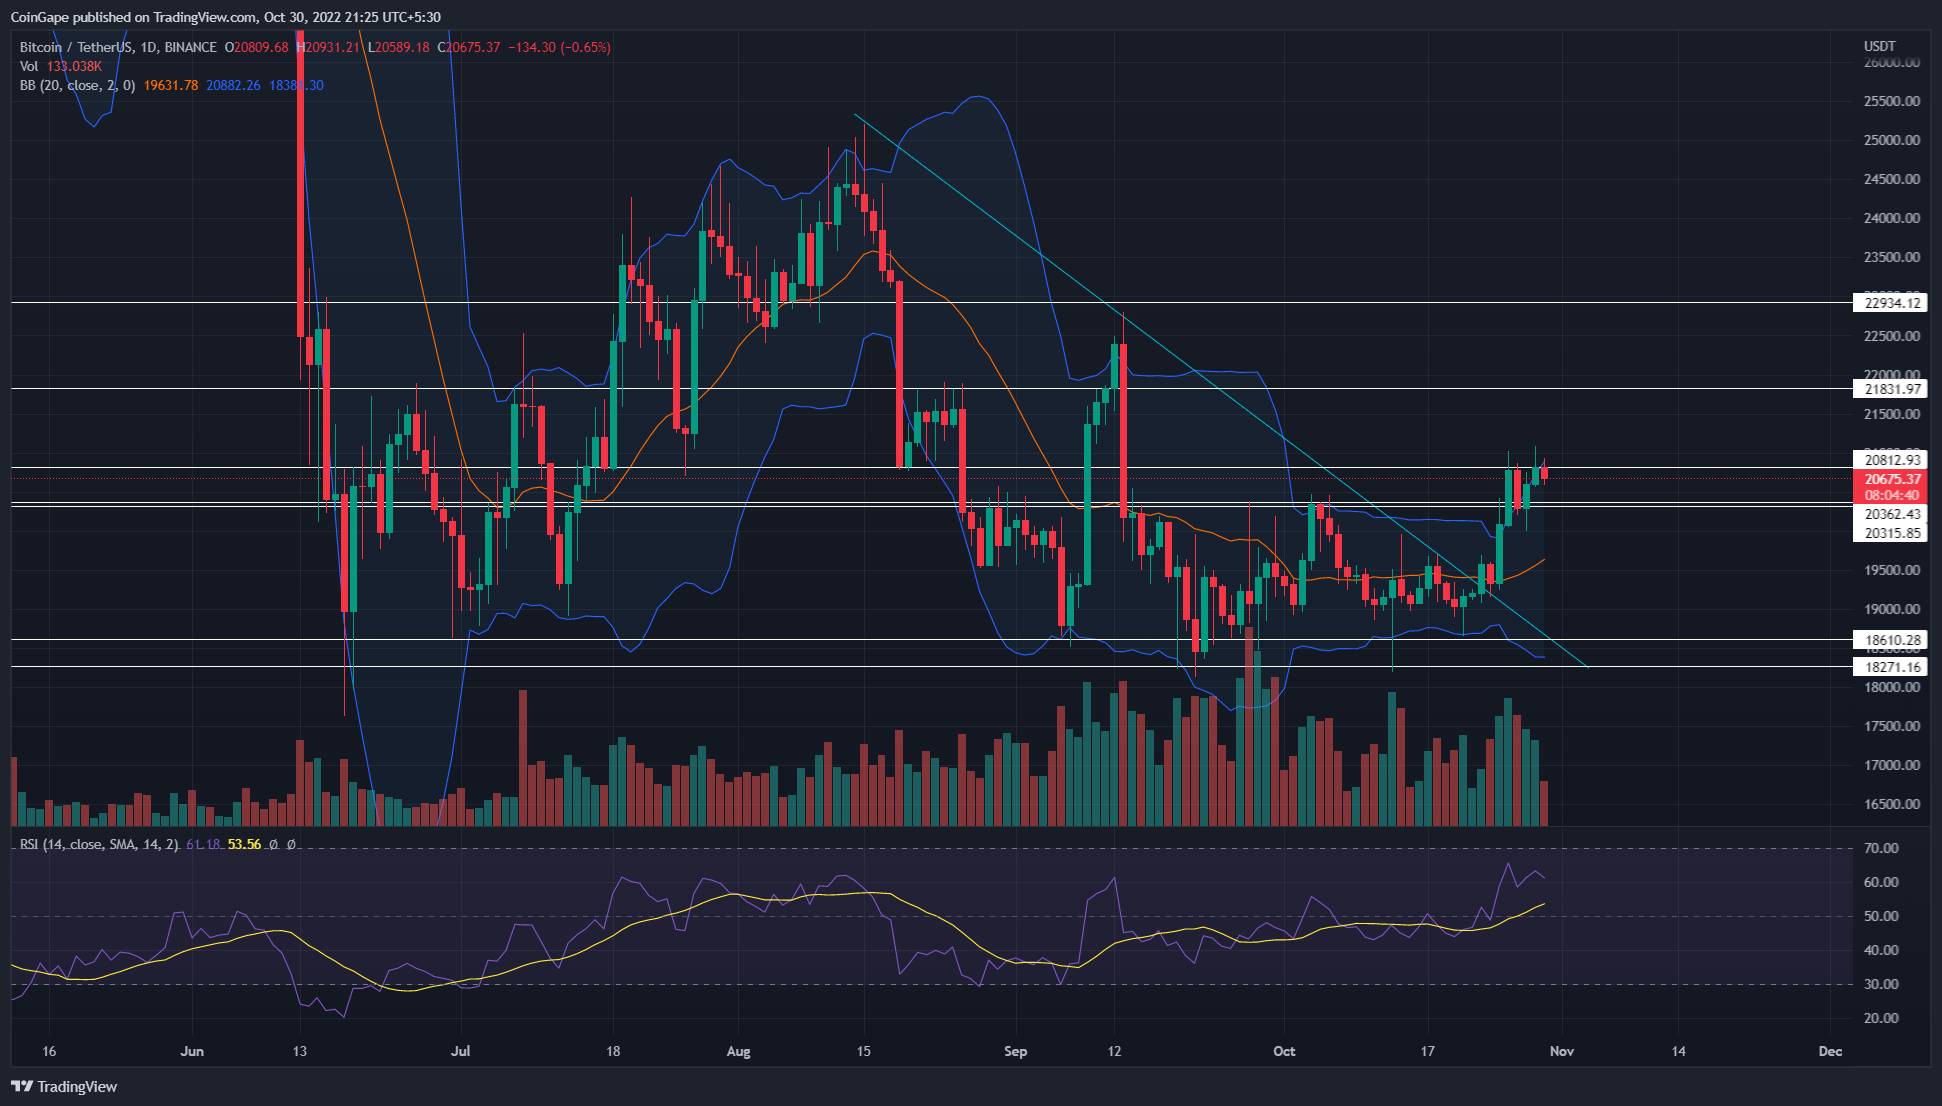
Following the early week rally, the Bitcoin price turned sideways on the weekend. This lateral walk between $20350 and $20800 offers a break period to replenish the bullish momentum. A bullish breakout from this range will resume the prior recovery and potentially regain high grounds.
Key points:
- Steady growth in volume activity during the recent rally indicates buyers are confident about climbing higher levels
- The 20-and-50-day EMA on the verge of bullish crossover should attract more buyers in the market.
- The intraday trading volume in Bitcoin is $32 Billion, indicating a 20% loss.
 Source-Tradingview
A bullish breakout from the descending triangle pattern on October 23rd triggered a recovery rally in the BTC/USDT pair. Amid the improvement in the global market, the Bitcoin price has increased 8.4% since last week.
In addition, this bull run recently breached a local resistance of $20350-$20300 but failed to rise to the next immediate supply zone at $20800. The Bitcoin price has resonated between the aforementioned levels over the last four days, indicating a narrow range formation. The long-wick rejection of either side of the range suggests uncertainty from both parties.
However, considering the overall recovery sentiment in the market, the BTC price is witnessing a temporary pause before resuming the prevailing rally. Thus, a long positional near $20300 could favor interested buyers.
Considering the market maintains its bullish outlook, a daily candle closing above $20800 will signal a continuation of ongoing recovery. This development could drive the prices 5.5% higher from its current price and hit the $22000 ceiling.
On a contrary note, a breakdown below the $20000 or 20-and-50-day EMA would undermine the bullish thesis.
Technical Indicator
Relative Strength Index: the daily-RSI slope sustains above the 60% mark, indicating the market participant favors further growth.
Bollinger band: the bitcoin price constantly hitting the indicator’s upper band accentuates the price need to stabilize its prior gains.
Bitcoin Price Intraday Levels
- Spot rate: $20718
- Trend: Sideways
- Volatility: medium
- Resistance level- $20800 and $22000
- Support level- $20350-$20300 and $18600
The presented content may include the personal opinion of the author and is subject to market condition. Do your market research before investing in cryptocurrencies. The author or the publication does not hold any responsibility for your personal financial loss.
Close Story


Leave a Reply