XRP traders can buy at this range with stop-loss below $0.36
Disclaimer: The findings of the following analysis are the sole opinions of the writer and should not be considered investment advice.
In the past few days, Bitcoin was able to defend the $20.8k support level and rapidly climbed from those lows to trade at $23.8k at press time.
The $20k area was seen as crucial support, and even though bears threatened to push it lower, they were unable to. This in turn enabled XRP to see a bullish period over the past couple of weeks.
It traded right beneath a resistance level at the time of writing, but there was evidence of steady demand in recent weeks behind XRP.
XRP- 1-Day Chart

Source: XRP/USDT on TradingView
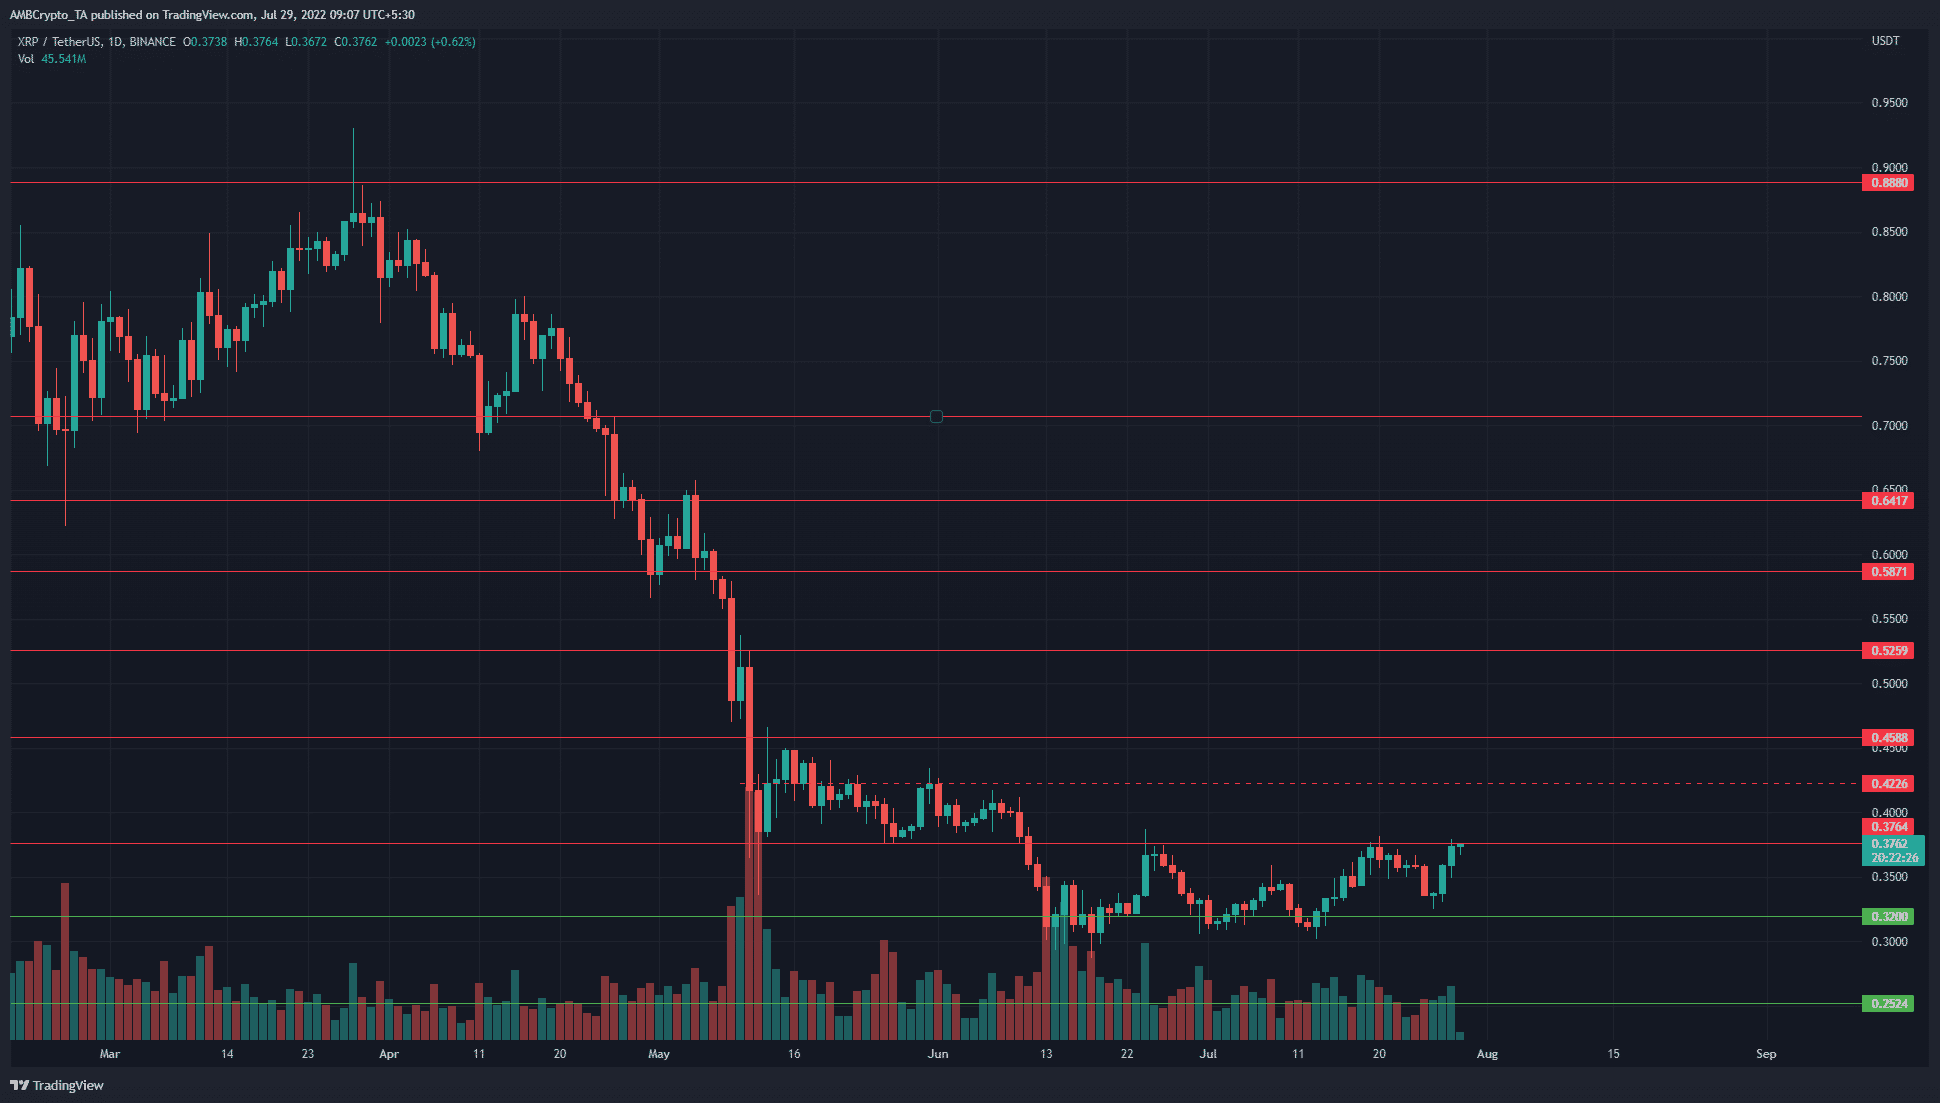
The higher timeframe picture was heavily bearish for XRP. The asset has shed 58% of its value in the market in four months. The downtrend has persisted but in mid-July, XRP was able to break the previous lower high of the downtrend at $0.368.
It has not advanced much from this area, but over the past month, the $0.31-$0.32 demand zone was defended. Moreover, the buyers were able to force a rally to the $0.37 resistance as well. This suggested that in the next two weeks to a month, XRP could flip $0.37 to support and establish a range.
Since mid-June, it can be argued that XRP has ranged from $0.36-$0.31. At press time it appeared to be on the verge of a breakout.
Rationale

Source: XRP/USDT on TradingView
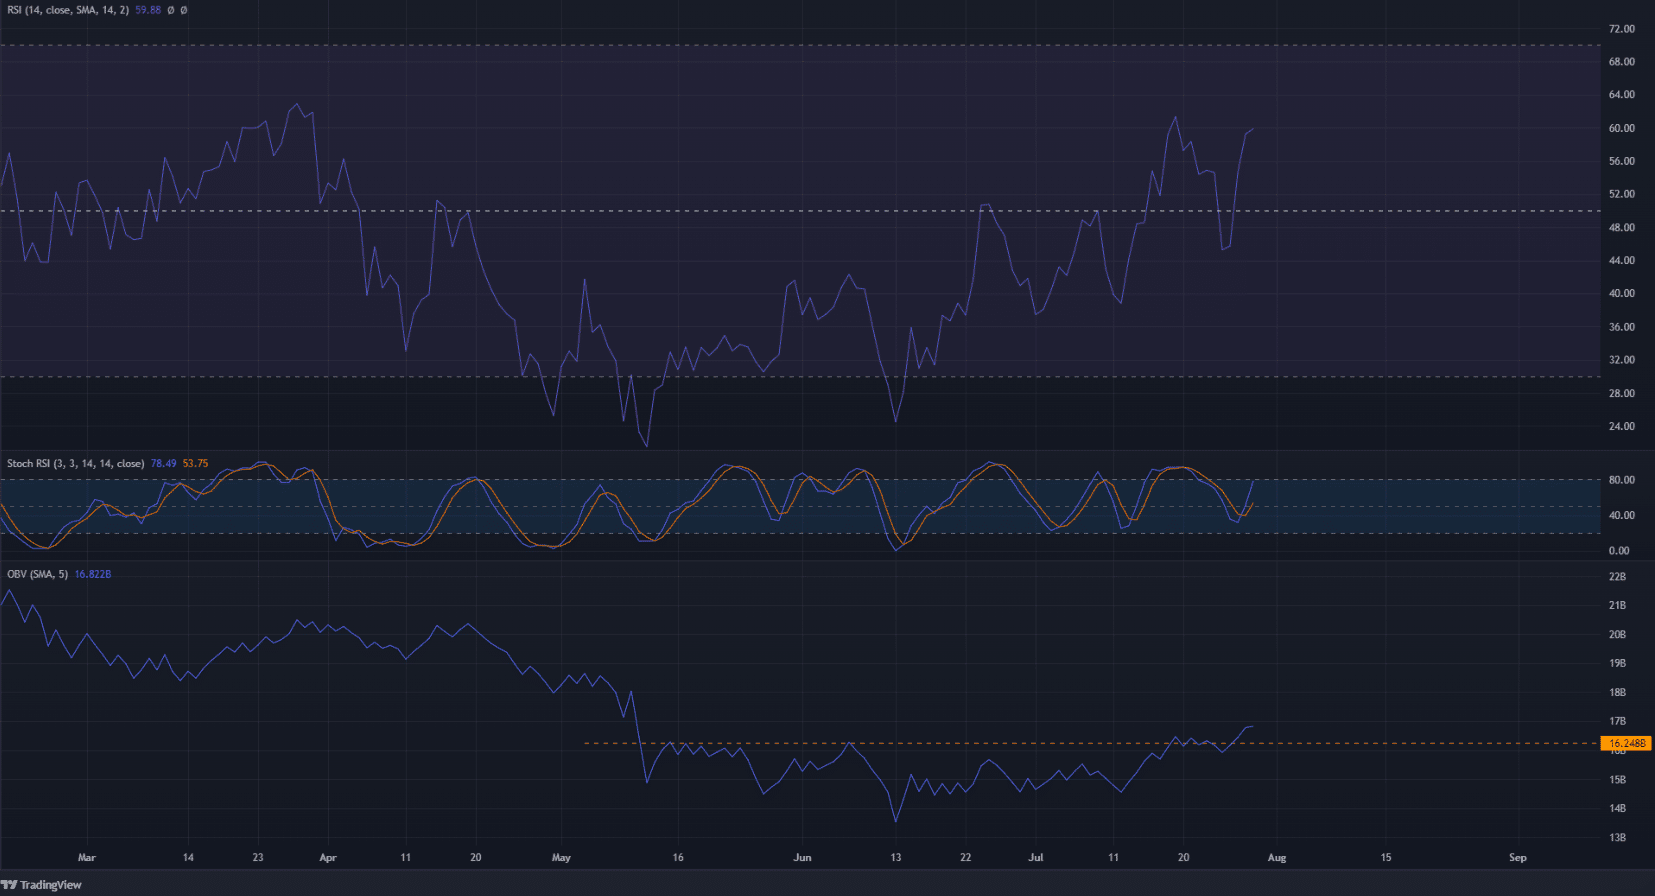
So which was it, resistance at the range highs or a breakout past $0.37? The RSI and the OBV on the daily chart helped shed some light on that. It can be seen that the RSI was able to climb above neutral 50 and stay above 45 as well.
The recent pump from $0.33 saw the RSI climb to stand at 59, which indicated significant bullish momentum. Furthermore, the RSI above neutral 50 also indicated an uptrend in progress.
The Stochastic RSI was also climbing toward the overbought territory, another small sign of upward momentum. Far more important than the Stochastic RSI, the OBV formed higher lows in the past couple of months. It broke above resistance from May in the past few days as well.
Conclusion
The daily OBV and RSI showed that a continuation of the move upward can be expected. To the north, $0.42 and $0.45 are important resistance levels to watch out for. On lower timeframes, a retest of the $0.37 area as demand can be used to buy XRP, with a stop-loss below the $0.36 mark.


Leave a Reply