

XTZ Price Poised For 23.5% Fall As Bearish Pattern Emerged Again
[ad_1]

Published 22 mins ago
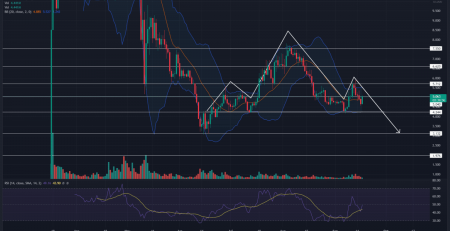
The XTZ/USDT technical chart reflected a texted book example for an inverted flag pattern in response to the previous two-month recovery. The same pattern was observed from Mid-may to early June recovery and triggered a 38% downfall upon breakdown. Will XTZ prices face the same fate this time?
Key points from XTZ analysis:
- The XTZ price has depreciated 17.6% in the last six days
- The 20-and-50-day EMA slopes are poised for a bearish crossover
- The intraday trading volume in the Tezos coin is $42.1Million, indicating a 6% hike.
 Source- Tradingview
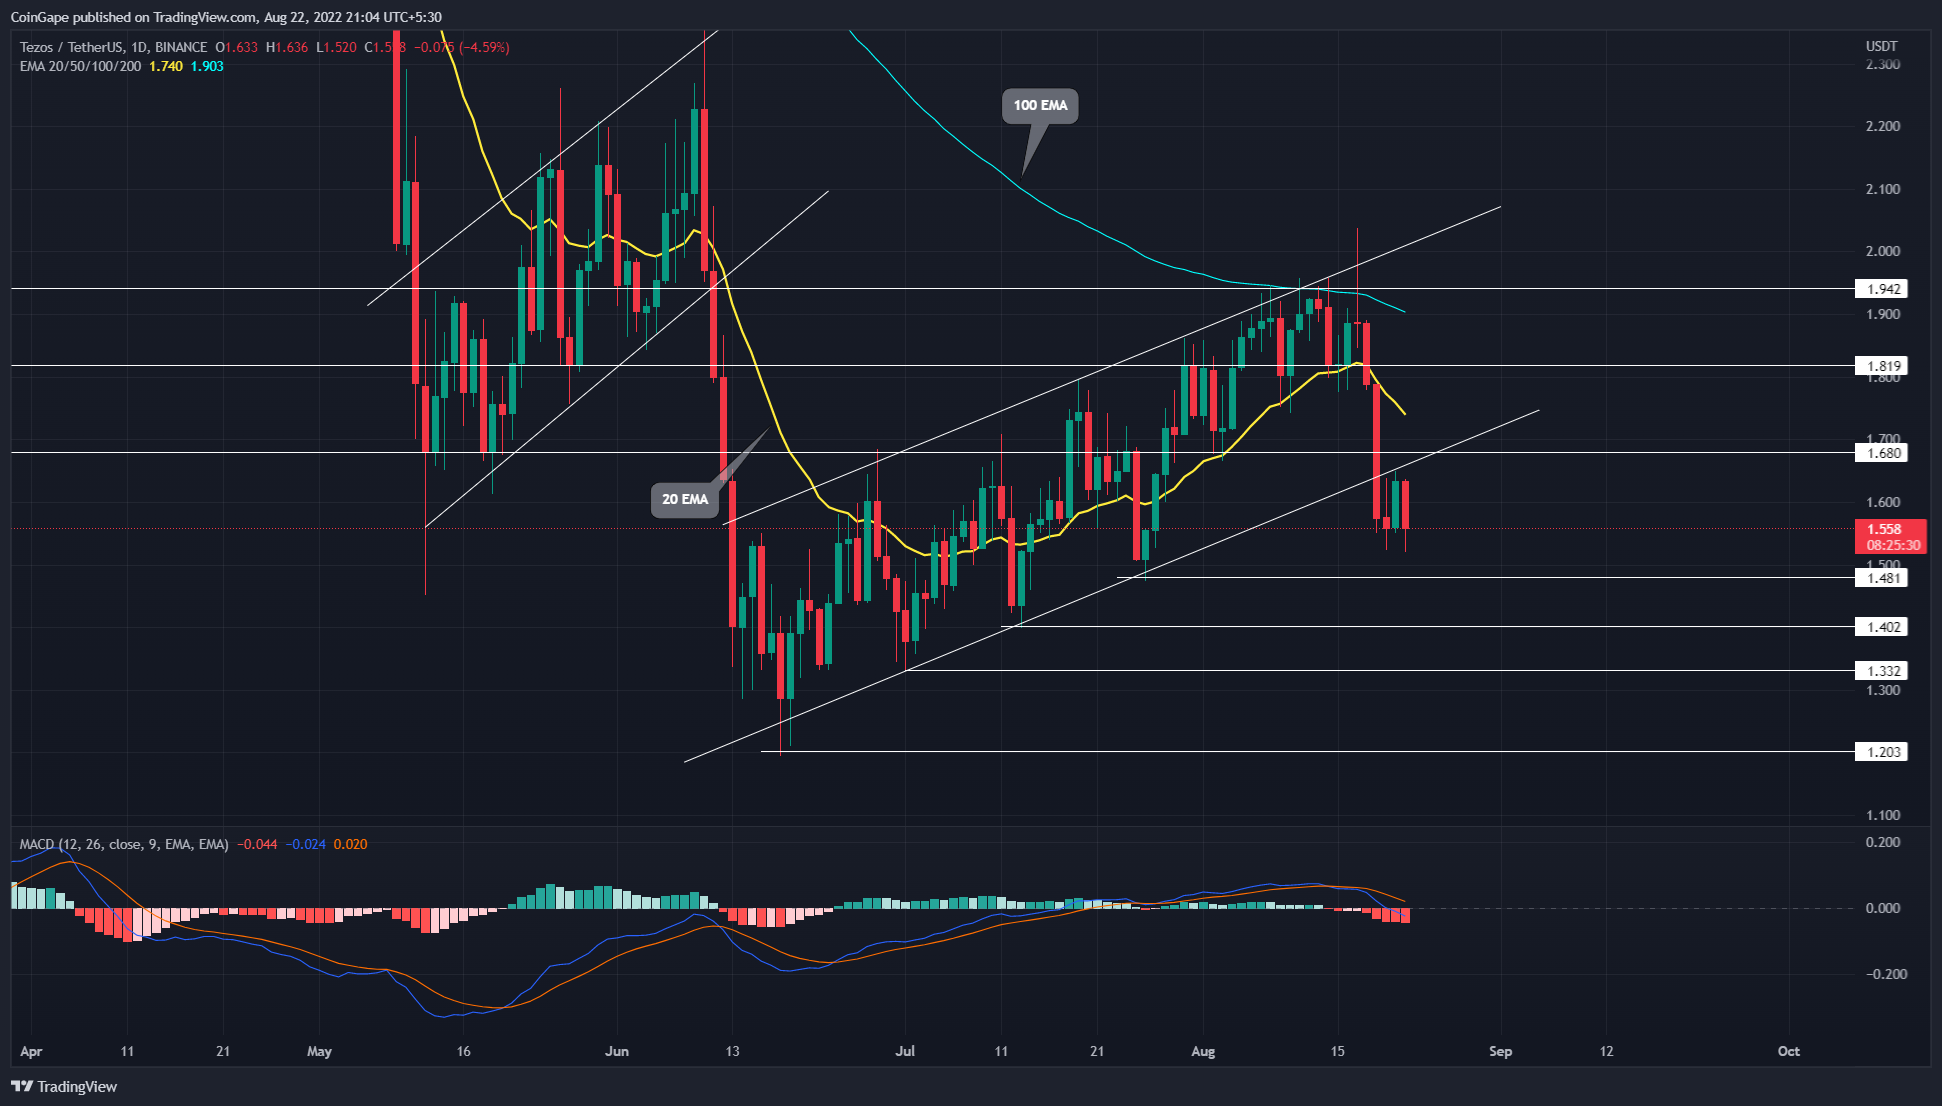
On August 17th, the XTZ/USDT pair turned down from the combined resistance of $1.94 and the pattern’s trendline with an evening star candle. However, the resulting correction extended beyond the support trendline as the crypto market witnessed sudden selling pressure.
As a result, on August 19th, the XTZ price triggered the bearish continuation pattern with a massive breakdown from the lower trendline. In theory, this pattern provides a sufficient relief rally for the market price to stabilize before continuing the prevailing downtrend.
Following the breakdown, the XTZ price went through a two-day retest phase, which tested the breached trendline as potential resistance. Thus, altcoin turned down from this flipped resistance today with a 5.33% loss providing an excellent follow-up candle.
This pattern completion provides multiple targets for short-sellers, which they could grab as per their profit appetite. These potential target levels are $1.48, $1.4, $1.33, and the June low of $1.2.
Though the price action favors a seller’s market, if buyers wrestled for trend control at $1.55 and reverted the price above the breached trendline, the bearish thesis will get invalidated.
Technical indicator
MACD indicator: the wide gap between the MACD and signal slope accentuates active selling from traders. In addition, the slopes on the verge of dropping below the midline support the potential downfall.
EMAs: The XTZ price recent reversal from the 100-day EMA indicates the overall trend remains bearish. Moreover, the coin price breakdown from the dynamic support of the 20-day EMA gives an extra edge to sellers.
- Resistance levels- $1.68, $1.82
- Support levels- $1.48 and $1.4
The presented content may include the personal opinion of the author and is subject to market condition. Do your market research before investing in cryptocurrencies. The author or the publication does not hold any responsibility for your personal financial loss.
Close Story
[ad_2]
Source link


Leave a Reply