

Should you consider buying MATIC? The technical indicators point to this
Disclaimer: The findings of the following analysis are the sole opinions of the writer and should not be considered investment advice.
Polygon [MATIC] found renewed buying pressure over the last month as the buyers continue to inflict a streak of green candles on the daily chart. This trend-altering comeback aided the bulls in propelling the price above the EMA ribbons.
The bulls were able to reclaim critical support levels after a well-needed push from the ascending triangle breakout. A sustained bullish effort could aid the buyers in breaching the $0.95 resistance in the coming sessions. At press time, MATIC was trading at $0.9446, up by 1.7% in the last 24 hours.
MATIC Daily Chart
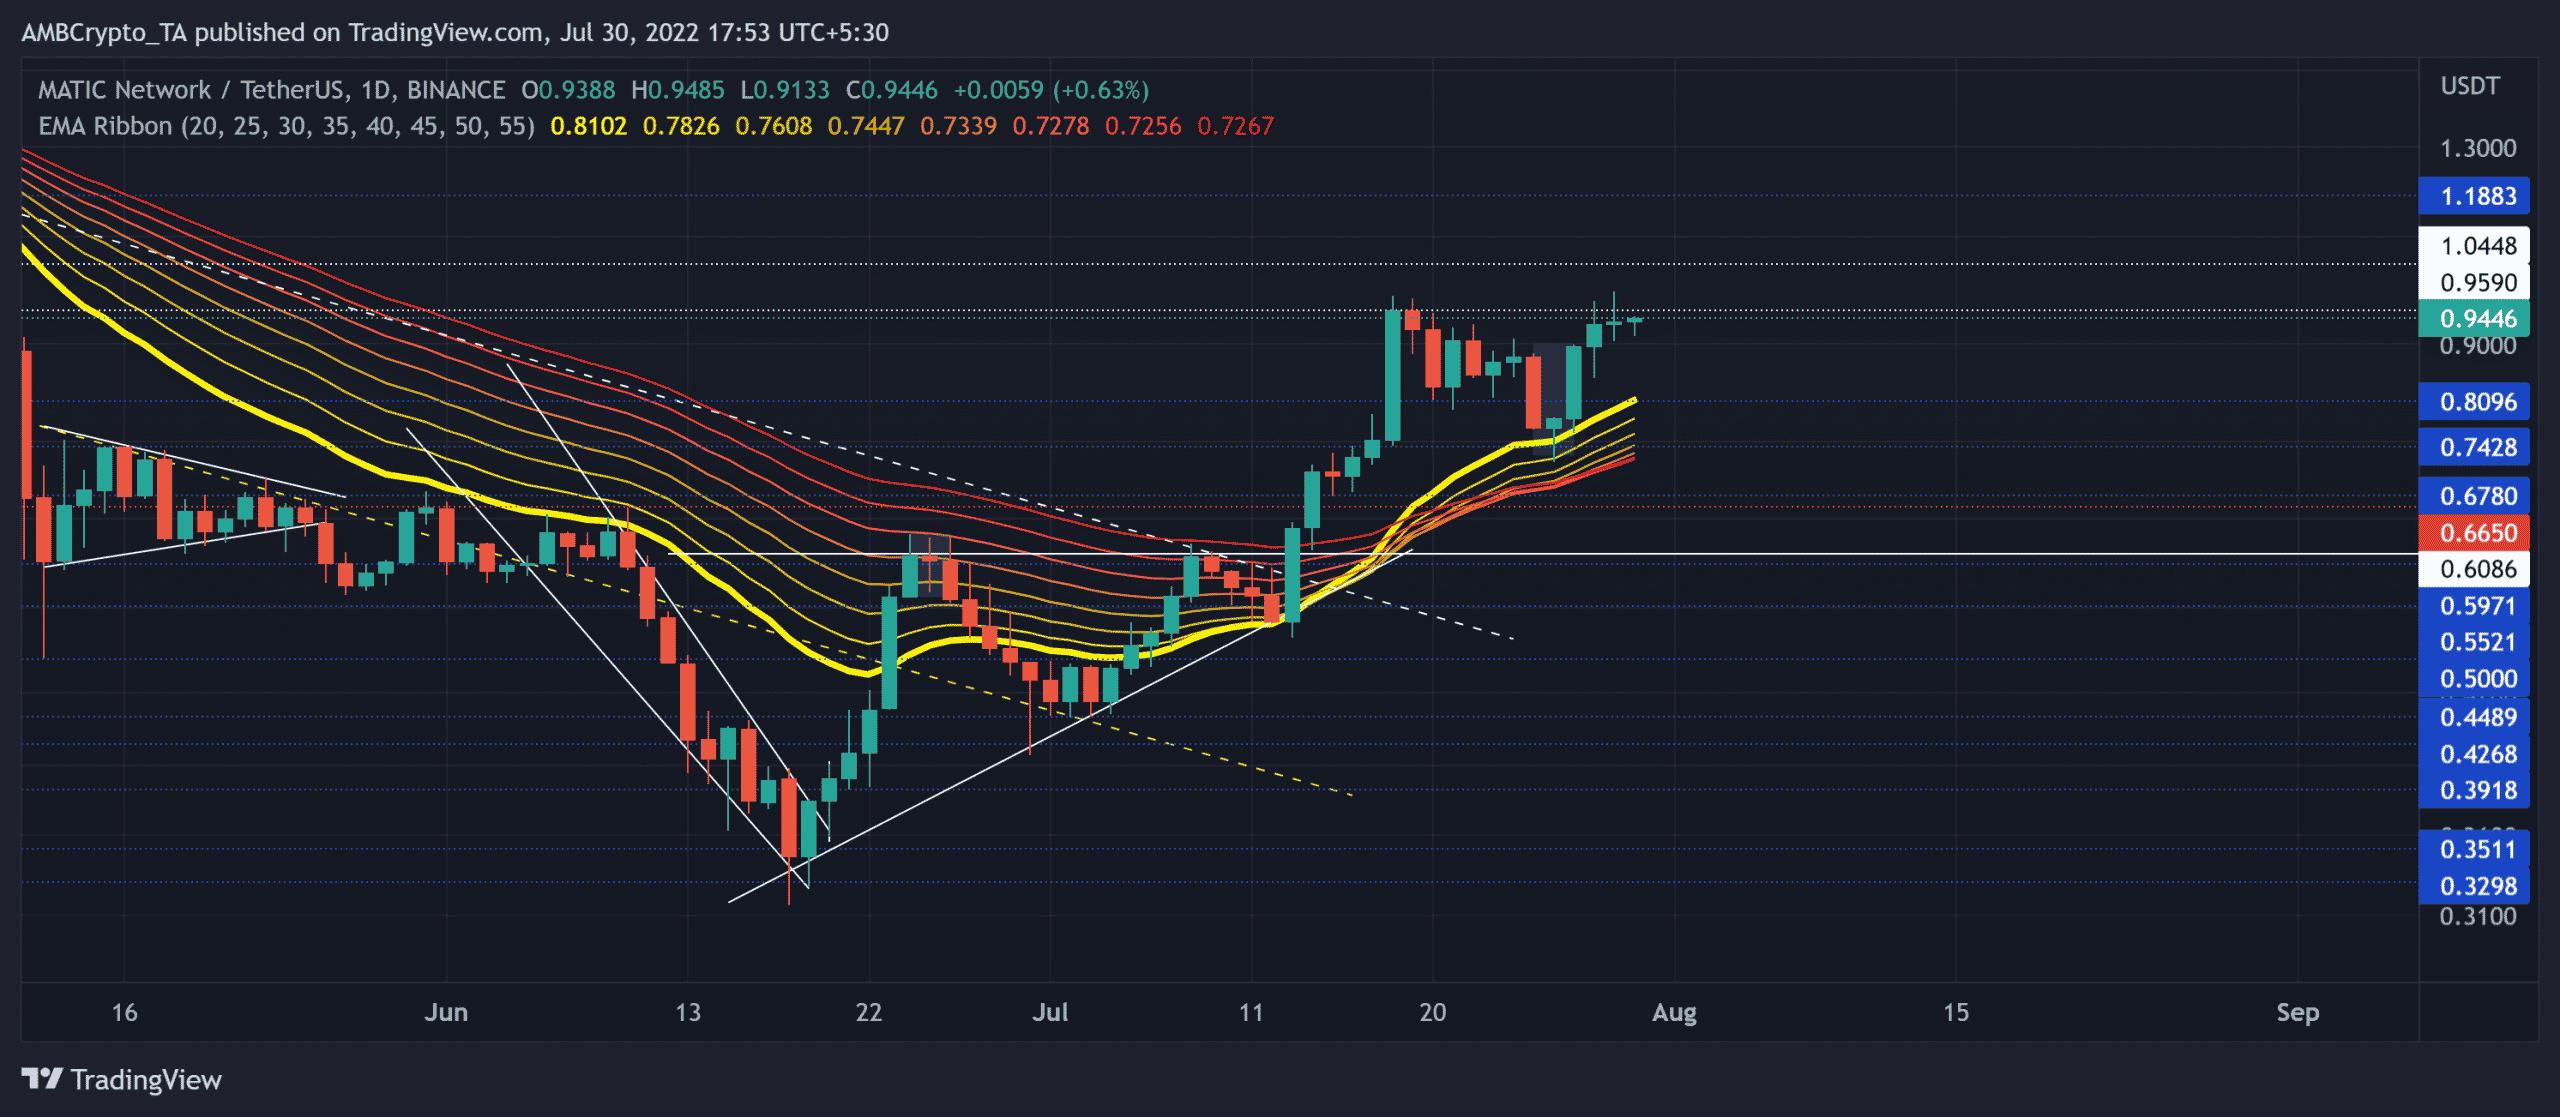
Source: TradingView, MATIC/USDT
MATIC’s descent phase entailed a two-month retracement that resulted in an over 81% devaluation (from 1 April) on the charts. After a gradual improvement in the overall sentiment, buyers recouped their forces in the $0.32 region.
This reversal opened doorways for a break above the northbound EMA ribbons. The ribbons undertook a bullish flip after nearly six months. Historically, such flips have ensured near-term support in the 20 EMA zone.
Any potential reversals from the $0.95 resistance could find rebounding grounds in the $0.78-$0.81 range. An eventual breach of the immediate resistance could position MATIC to retest the $1.1 mark in the coming days. To disregard these near-term bullish tendencies, the bears needed to inflict a close below the $0.72-level.
Rationale
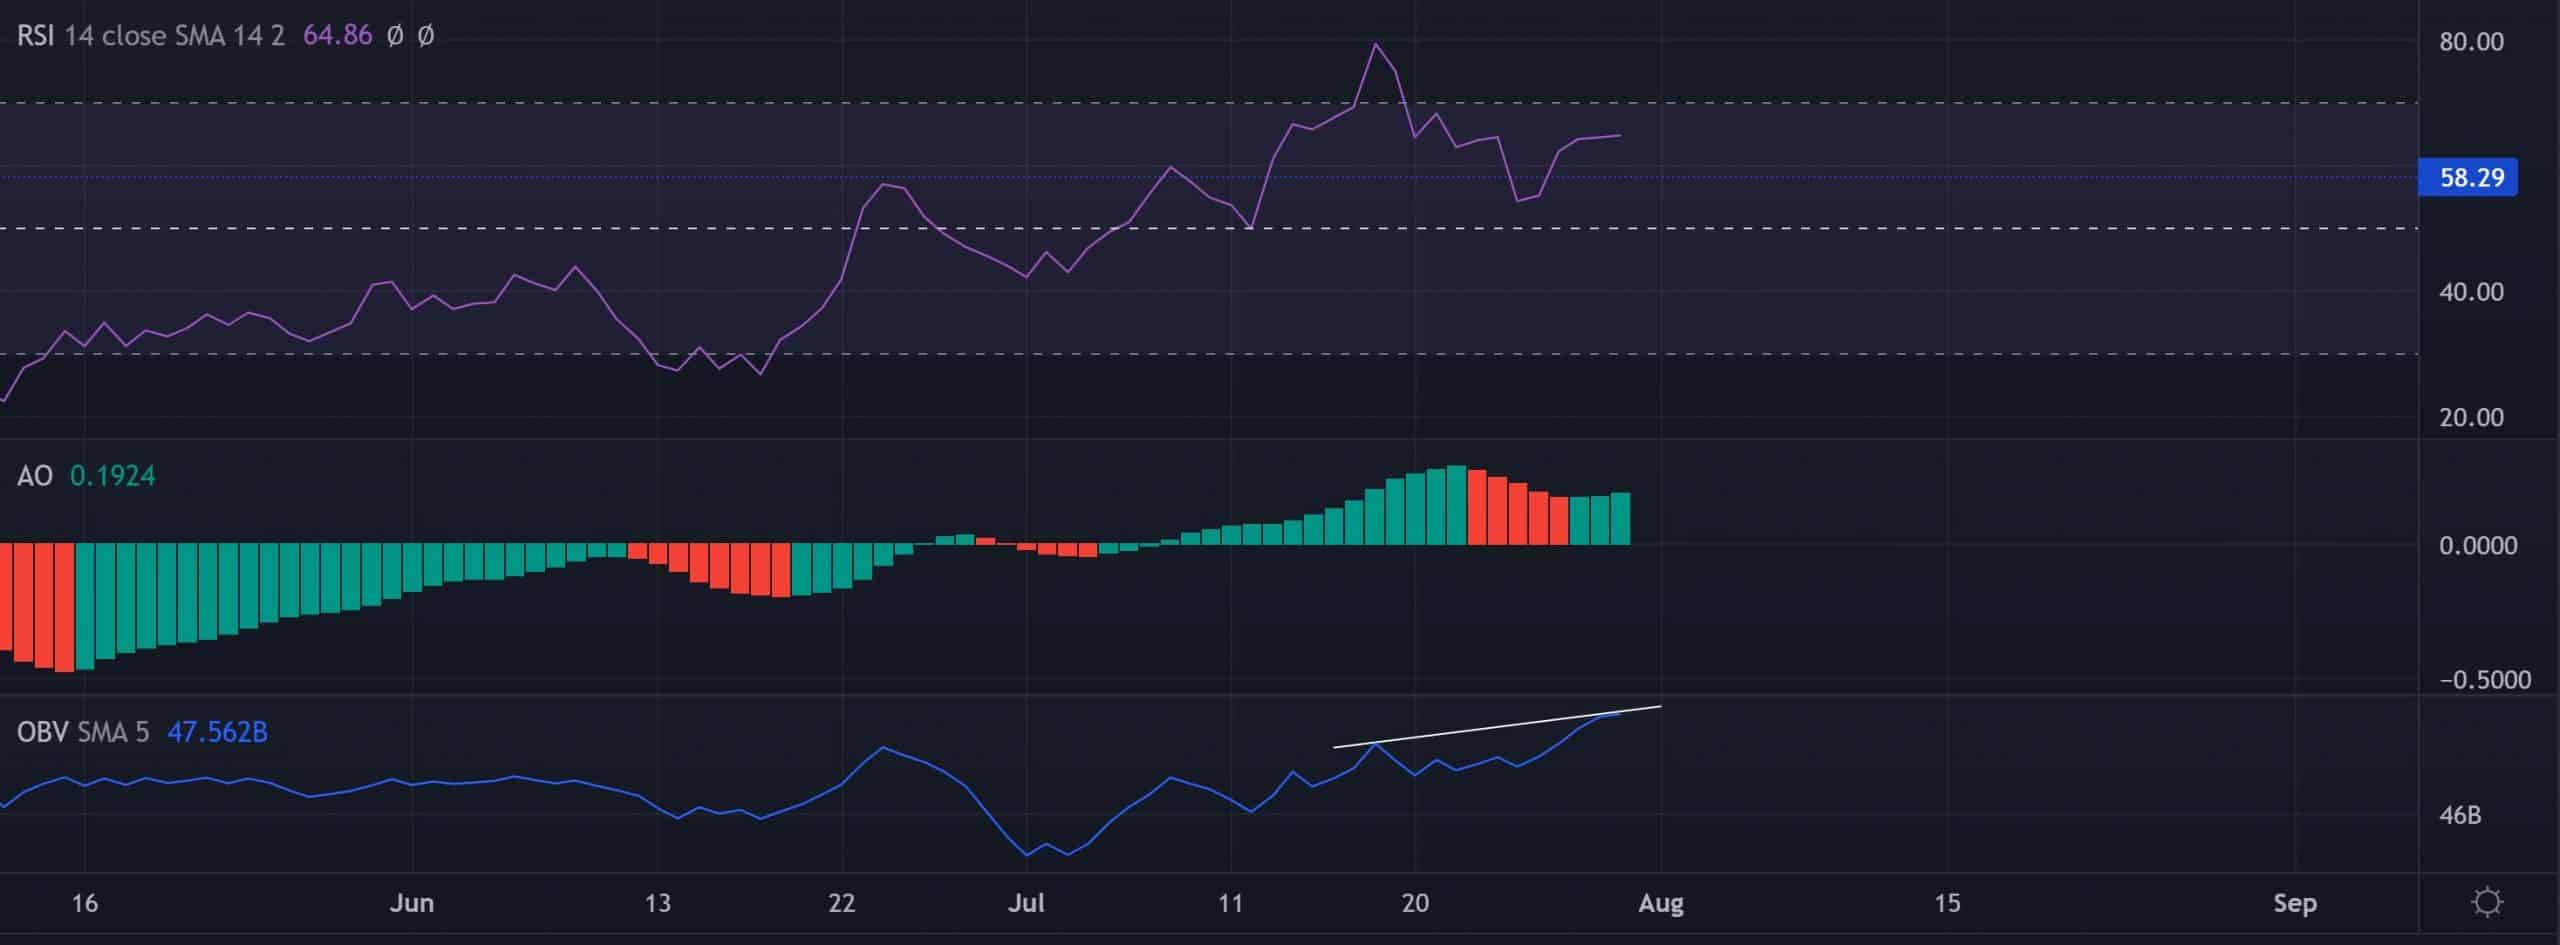
Source: TradingView, MATIC/USDT
The Relative Strength Index (RSI) gradually declined from the overbought mark. But a sustained position above the 58-mark support could continue supporting the near-term buying endeavors.
Also, the Awesome Oscillator (AO) conveniently positioned itself above the equilibrium to reveal a strong buying momentum. Nevertheless, the Ob-Balance Volume (OBV) marked higher peaks over the last two weeks while the price action kept slamming the $0.95 resistance. This trajectory hinted at a mild bearish divergence.
Conclusion
The altcoin’s position above its north-looking EMA ribbons has reinforced the bullish narrative. The threats along the OBV could cause some setbacks. But the targets would remain the same as discussed above.
Finally, investors/traders must keep a close eye on Bitcoin’s movement as MATIC shares a staggering 90% 30-day correlation with the king coin.


Leave a Reply