

Ethereum Price Ongoing Uncertainty May End With Triangle Breakout

Published 20 mins ago
The Ethereum price has resonated between two converging trendlines for the past three months. Though this consolidation represents a no-trading zone, the altcoin under the influence of bearish patterns should replenish the bearish momentum. Are we revisiting the $1000 psychological support?
Key points:
- Completing the pennant pattern, Ethereum could witness a 14% downfall
- The Ethereum price face strong resistance from the 20-day EMA
- The intraday trading volume in Ethereum is $5.4 Billion, indicating a loss of 3.7%.
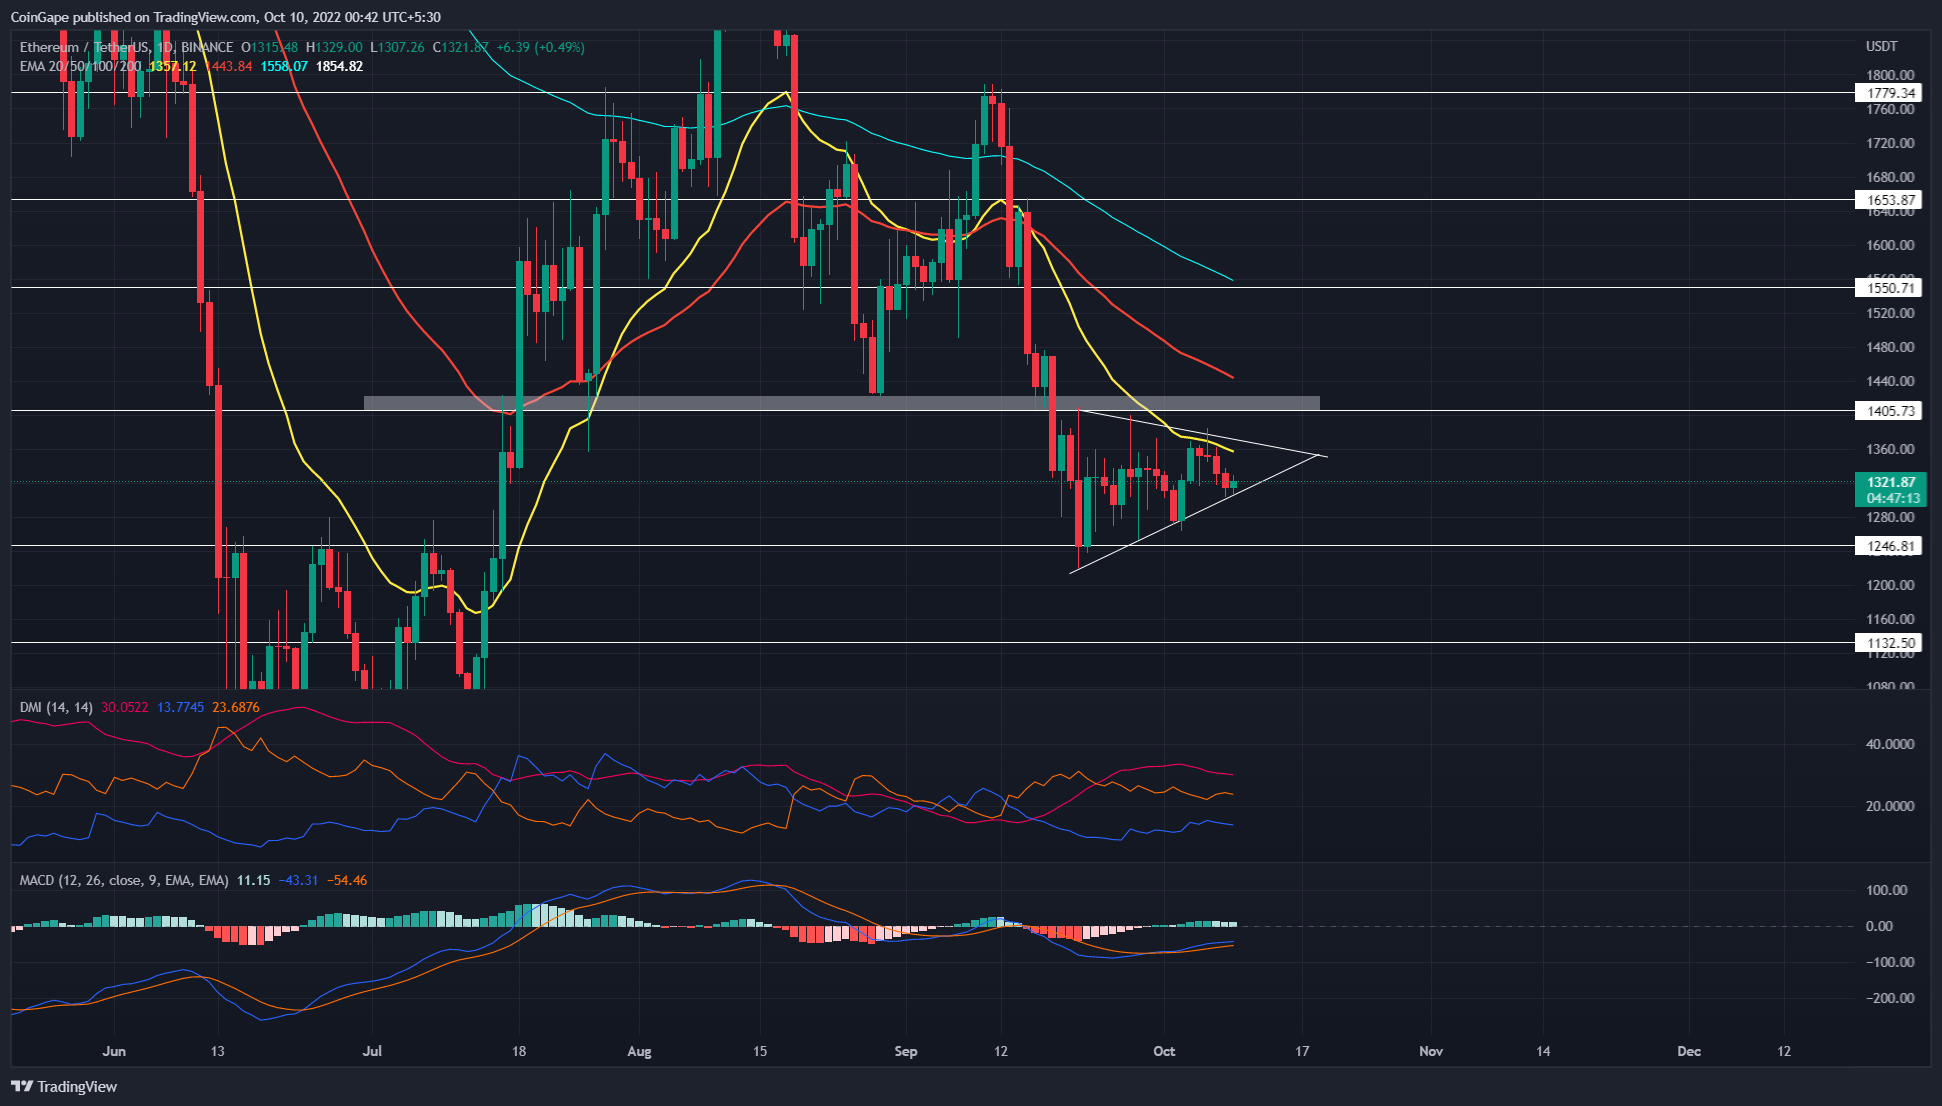 Source- Tradingview
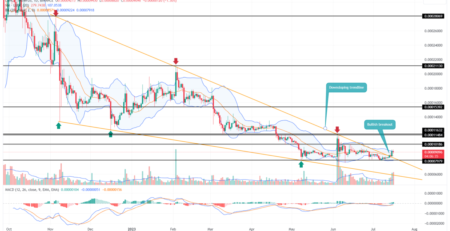
As mentioned in our previous article, the Ethereum coin price follows an inverted pennant pattern. Furthermore, this bearish continuation pattern offers a small consolidation phase where prices resonate between the two converging trendlines.
The asset price usually reaches the peak of the triangle formation and breaks the bottom support trendline as the indication to continue the prior downtrend. Therefore, the Ethereum price breakdown from the bottom trendline will release the trapped bearish momentum.
The potential downfall should break the $1250 support and pull the altcoin 14.3% down to $1130 support.
On a contrary note, the symmetrical triangle formation possesses a possibility to break the overhead trendline, which will invalidate the bearish thesis.
Currently, the Ethereum price is trying to rebound from the support trendline. Moreover, a bullish candle with lower price rejection indicates a potential upswing that should hit the overhead trendline.
This bullish reversal indicates the price will continue to consolidate in the no-trading zone for a few more sessions.
Technical indicator-
EMAs: the falling trend in the EMAs(20, 50, 100, and 200) emphasizes the long coming downtrend. Moreover, the 20-day EMA provides overhead resistance to the recovery rally.
DMI indicator: the recent spikes in the DI lines mimic the trend reversal projecting a long-shot possibility of a bullish crossover. Additionally, the growing ADX line reflects an increase in trend momentum.
Ethereum intraday price levels
- Spot price: $1324
- Trend: Sideways
- Volatility: High
- Resistance level- $1400 and $1550
- Support level- $1230 and $100
The presented content may include the personal opinion of the author and is subject to market condition. Do your market research before investing in cryptocurrencies. The author or the publication does not hold any responsibility for your personal financial loss.
Close Story


Leave a Reply