
Comparing Bitcoin Volatility With Nasdaq And S&P500 –
[ad_1]
Data shows Bitcoin’s monthly volatility has been lesser than both Nasdaq and S&P 500 recently, here are their numbers compared.
Bitcoin 30-Day Volatility Has Plunged Down To Just 1.4% In Recent Days
As per the latest weekly report from Arcane Research, the US equities having a higher 30-day volatility than BTC has only happened twice since the year 2017.
The “volatility” is an indicator that measures how the price of an asset (like Bitcoin) has differed in day-to-day returns over a period of time.
While this timespan can be however long, the relevant period in the discussion here involves the last thirty days.
When the value of this metric is high, it means the price of the asset has been observing large daily shifts in the past month. On the other hand, low volatility values suggest an overall stale price.
Something to note about the indicator is that it only takes into account the closing prices on each day. This implies that any intraday volatility is ignored by the metric.
Just recently, for example, the volatility experienced by Bitcoin following the CPI release was as high as 9% within 12 hours, but since by the time the daily close came the price had returned back to the range, the volatility as measured by the indicator was still low for the crypto.
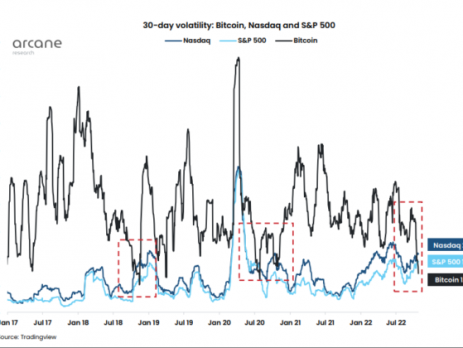
Now, here is a chart that shows how the monthly volatilities of BTC, Nasdaq, and S&P 500 have compared against each other over the last few years:
Looks like BTC has recently observed the lowest volatility out of the three | Source: Arcane Research's The Weekly Update - Week 42, 2022
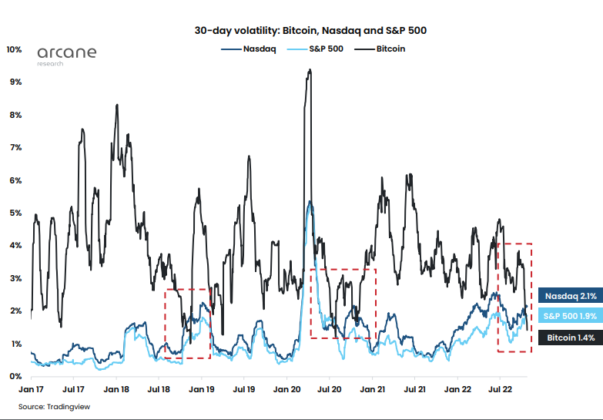
As you can see in the above graph, the Bitcoin 30-day volatility has sharply gone down during the last few months, while that of S&P 500 and Nasdaq has steadily climbed up.
The indicator’s value is now 1.4% for BTC, lower than both Nasdaq’s 2.1% and S&P 500’s 1.9%. Interestingly, there have only been two instances of this kind of trend since 2017.
The report notes, however, that the structure of BTC’s volatility going down while that of the equities’ rises is more similar to the November 2018 occurrence than the July 2020 one.
The November of 2018 also happens to be the month when the price of Bitcoin took a large hit as the then bear market reached its bottom.
BTC Price
At the time of writing, Bitcoin’s price floats around $20.6k, up 7% in the last week. Over the past month, the crypto has gained 7% in value.
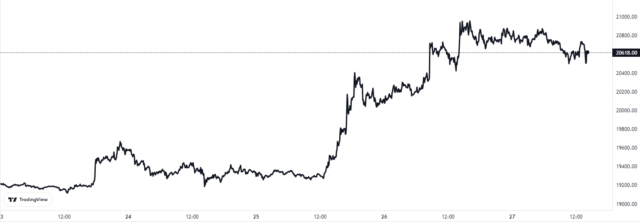
The value of the crypto seems to have shot up over the last couple of days | Source: BTCUSD on TradingView
Featured image from Chris Liverani on Unsplash.com, charts from TradingView.com, Arcane Research
[ad_2]
Source link


Leave a Reply