

Can Waves manage another bounce to $4.2 after its recent setback
[ad_1]
Disclaimer: The information presented does not constitute financial, investment, trading, or other types of advice and is solely the writer’s opinion.
Bitcoin rose to $19.5k, and the bearish order block it registered on lower timeframes has spurned the advances of the bulls. Downside targets include $17.8k.
If Bitcoin fell beneath $19k, it could also drag the rest of the crypto market along with it. Coinglass data showed nearly $120 million worth of liquidations for Bitcoin over the past 24 hours alone. Despite BTC’s weak bounce, Waves had some success moving above the $4 mark over the past two days.
WAVES- 4-Hour Chart
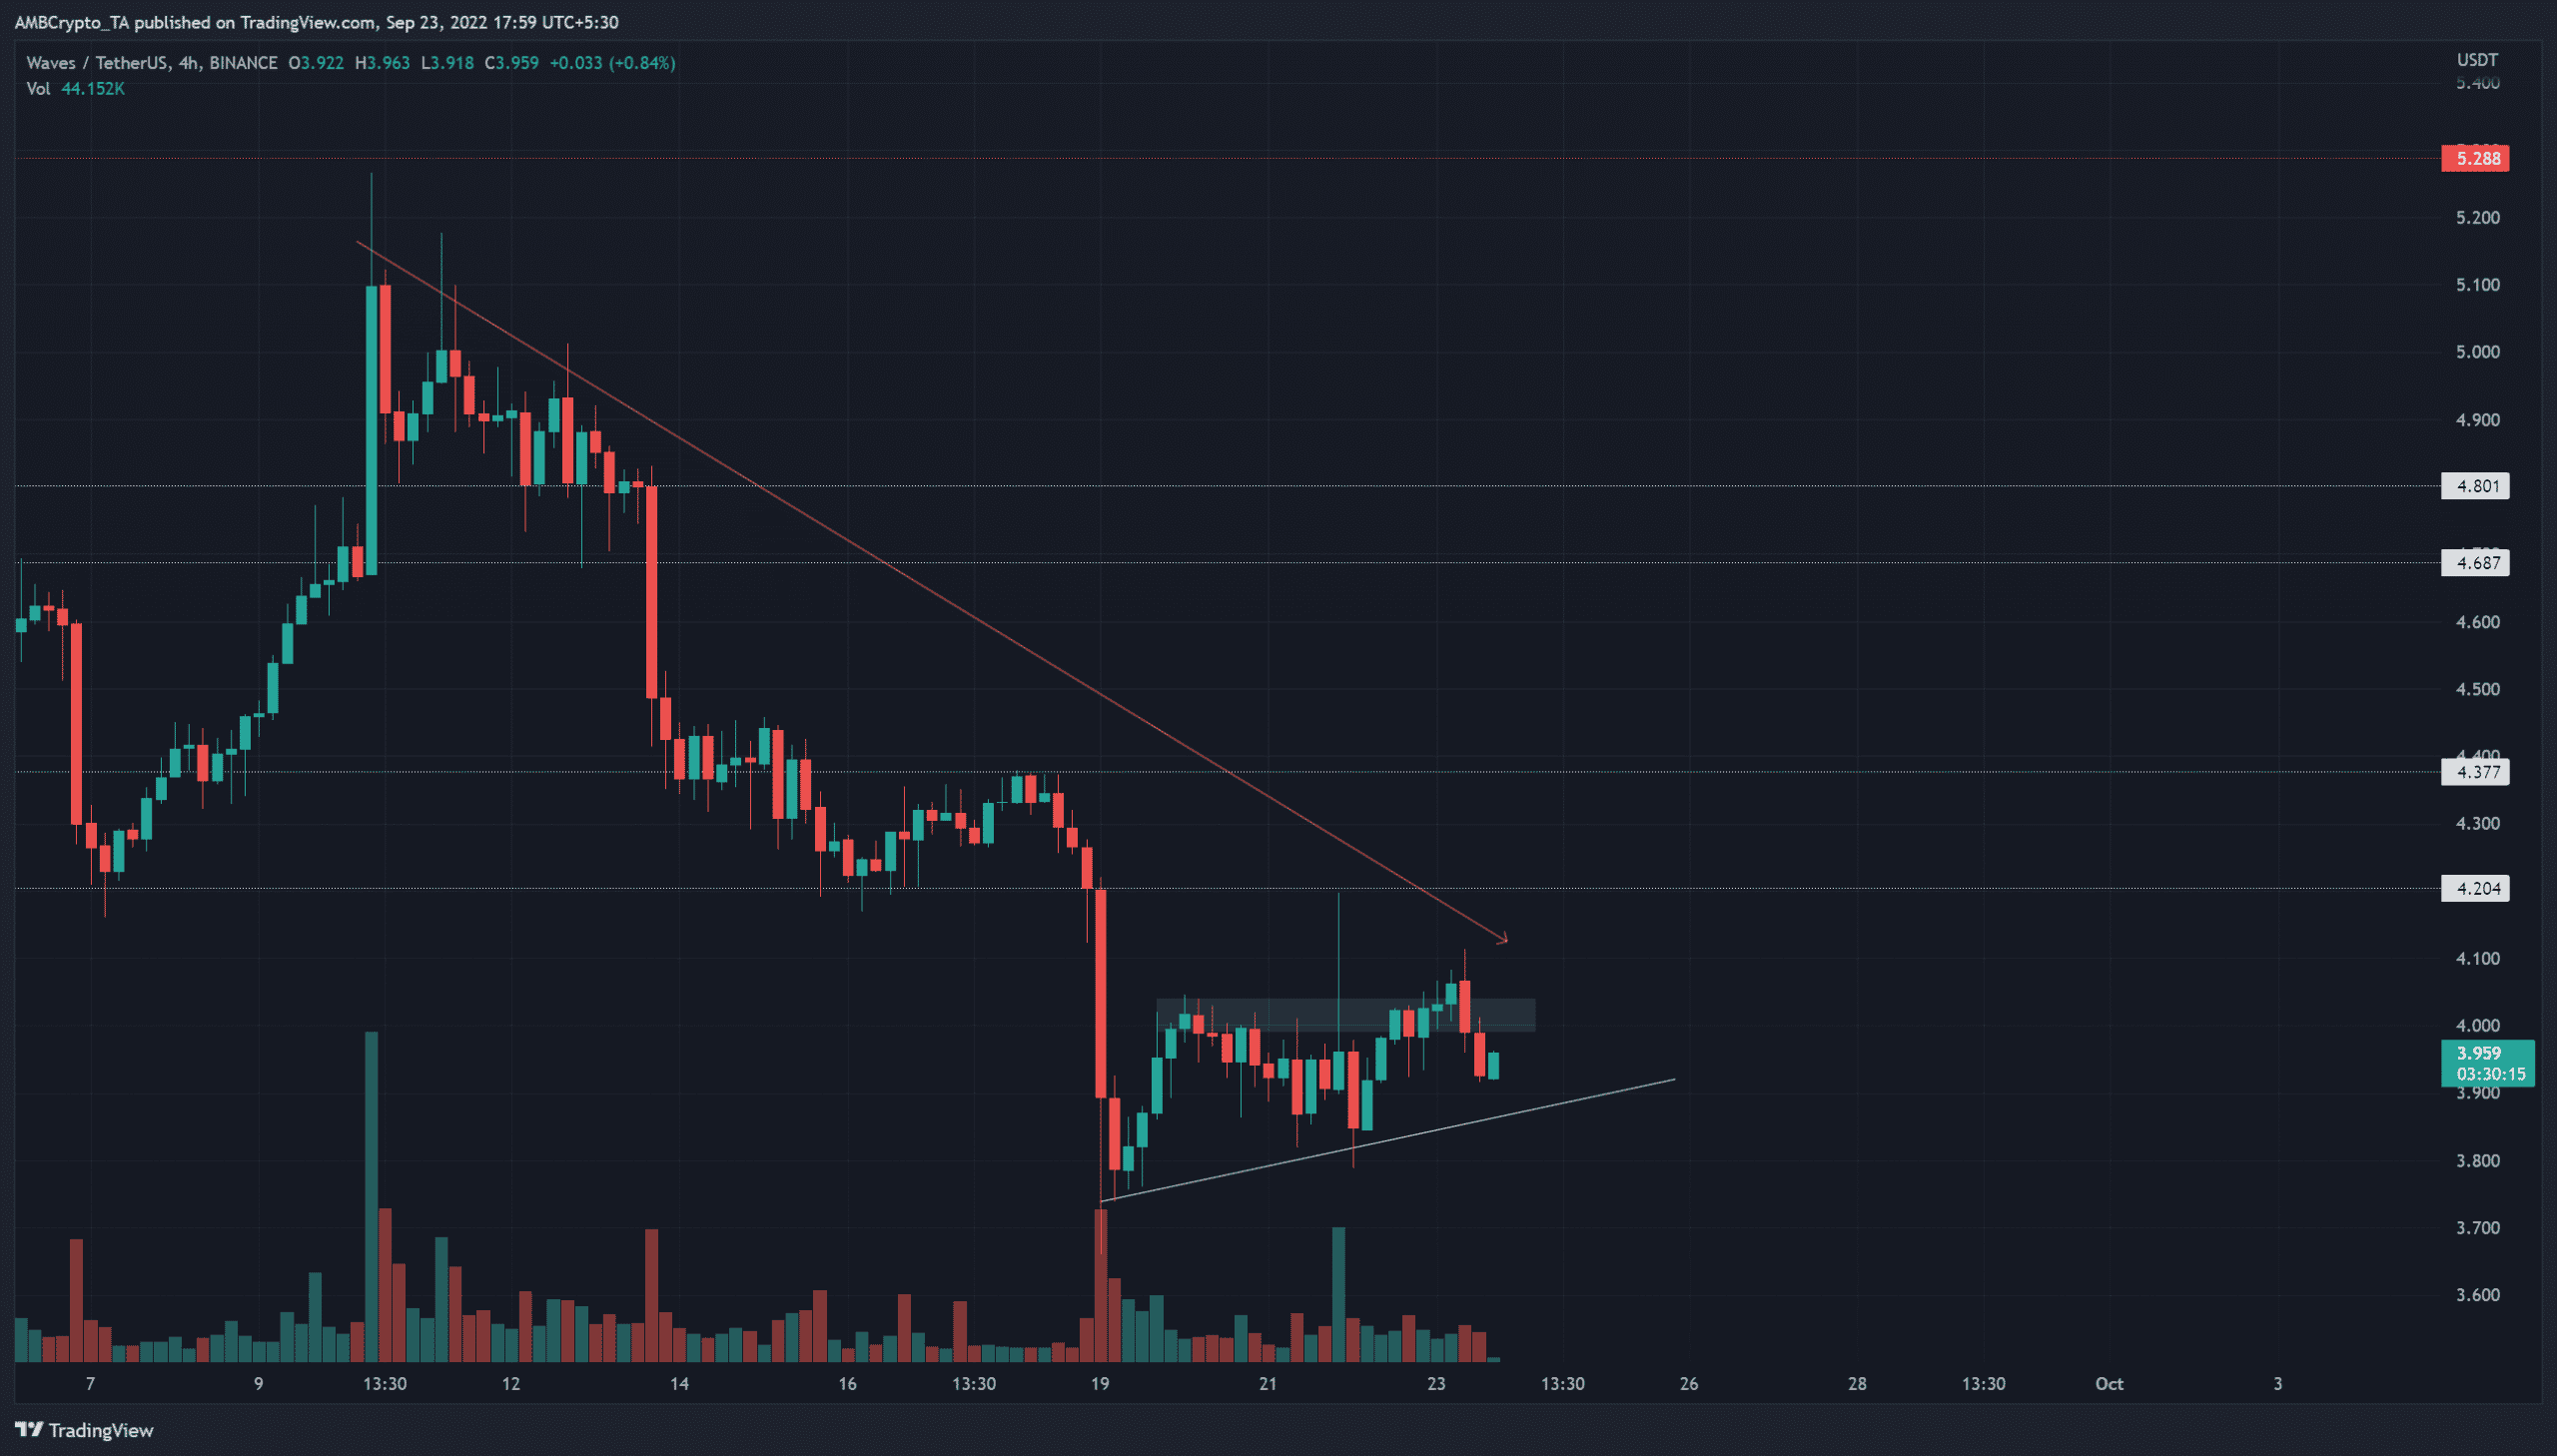
Source: WAVES/USDT on TradingView
The H4 chart showed that the price saw a strong move downward a week into September. The market structure flipped decisively bearish after WAVES was unable to hold on to $4.8 and blew right past $4.68 as well.
In the days that followed, the price bounced between the $4.2 and $4.37 levels without much intent. A few days ago, the $4.2 support failed and was retested as resistance.
In recent hours, Waves fell below the $4 level once again. A trendline support (white) was spotted but it might not be particularly strong since it has only two touches by the price on the chart.
WAVES- 1-Hour Chart
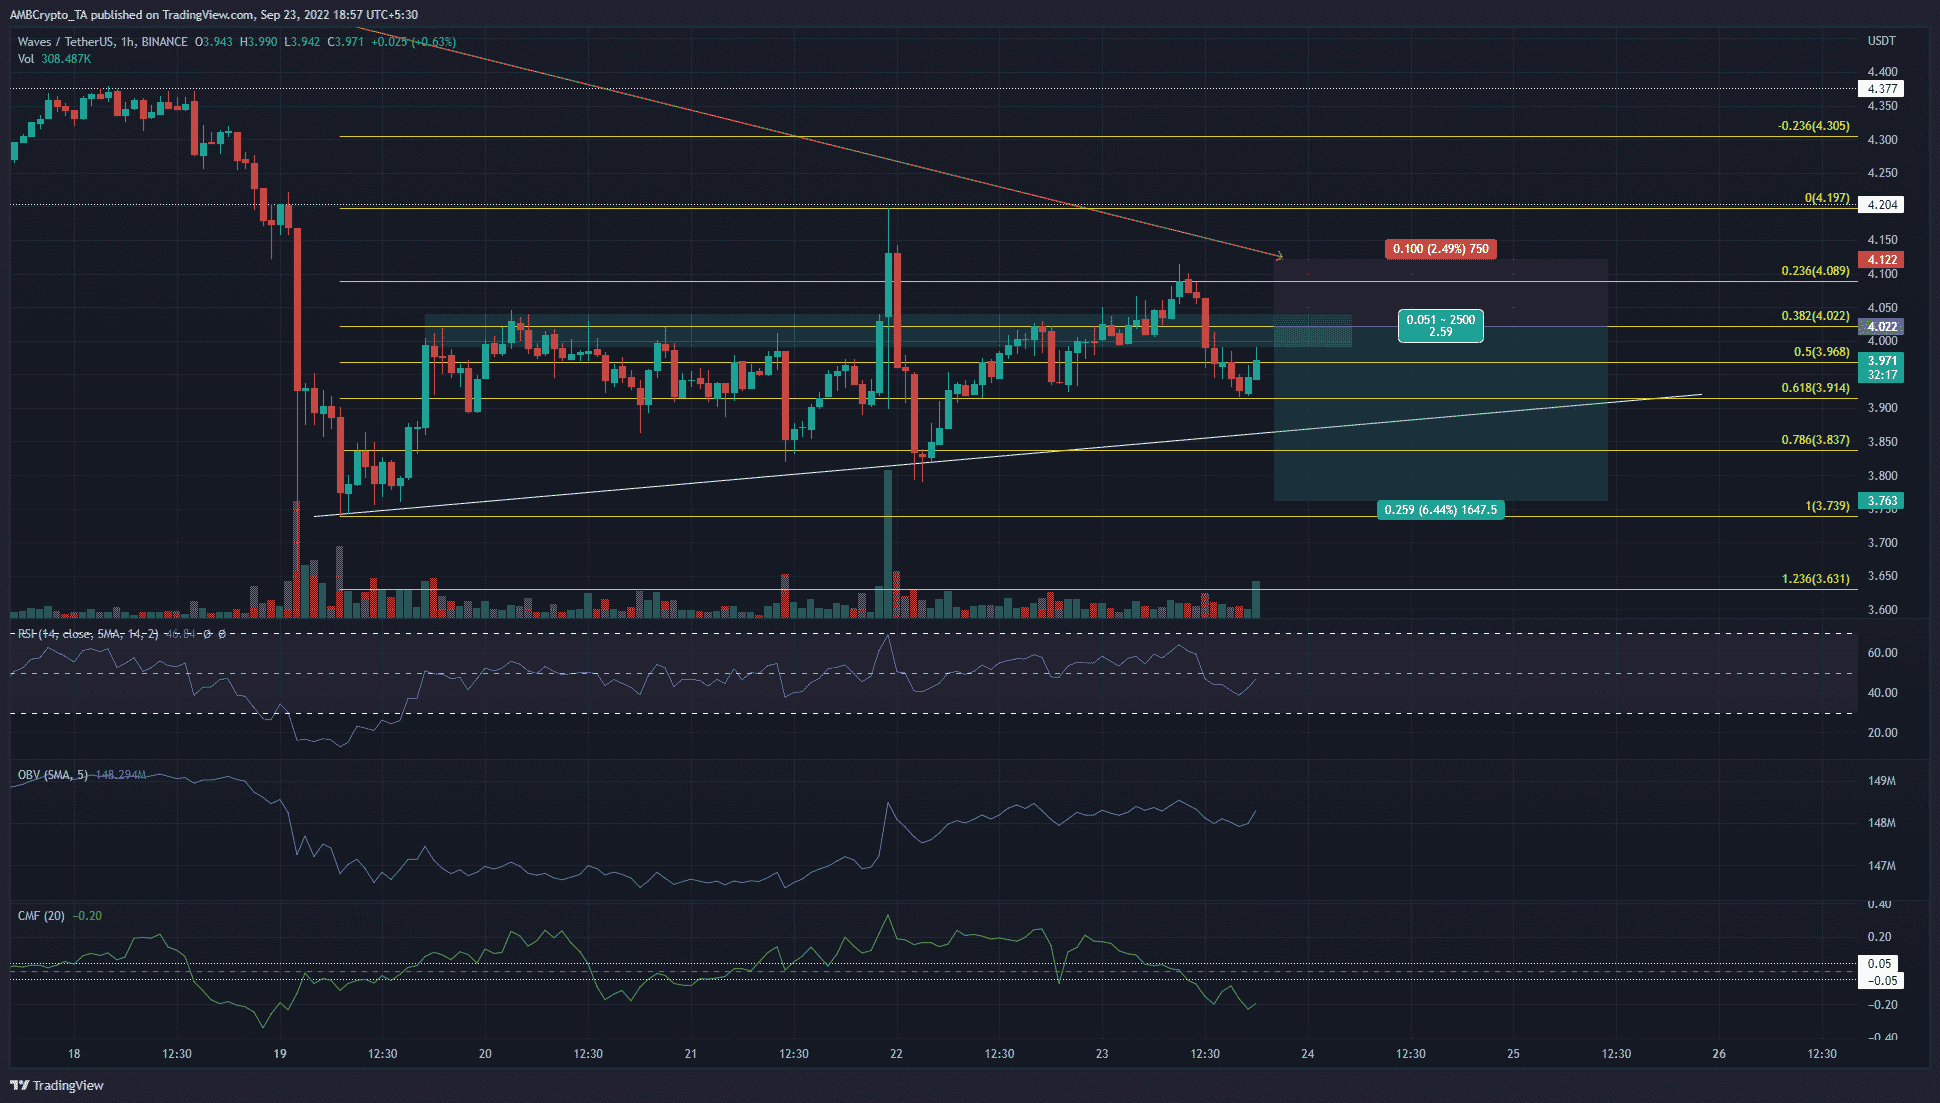
Source: WAVES/USDT on TradingView
For context, the higher timeframes (above H4) leaned more in favor of the bears than the bulls. The momentum has favored the sellers in the past two weeks, and the bounce from $3.7 was not particularly strong. Even the attempt to climb to $4.2 a couple of days ago was firmly rebuffed, and a push south to $3.8 immediately followed.
Therefore, any long positions in the $3.95 support zone would likely be quite risky. In the wake of WAVES unable to defend $4, it lent further credence to the bears having the upper hand in the short term. Hence, a selling opportunity could arise on a retest of the $4 zone (cyan).
The Fibonacci retracement levels (yellow) showed $4.02 and $4.08 could oppose buyers’ attempts to force prices higher. The RSI moved below neutral 50 to highlight bearish momentum. The CMF also slipped beneath -0.05 to show a significant amount of capital leaving the WAVES market.
The OBV did not see a sharp pullback yet and noted a lack of strong selling volume in the past week.
Conclusion
The price fell below $4, which was a significantly lower timeframe development. It momentarily halted at $3.92. A retest of the $4.022 mark would likely offer a selling opportunity. Invalidation of this bearish idea would be a move back above $4.08-$4.1. To the south, short sellers can look to book a profit at $3.83 and $3.76.
[ad_2]
Source link


Leave a Reply