

Buyers Prepare To Boost CRV Prices To $1

Published 4 hours ago
The long-term downtrend in Curve Dao (CRV) price reversed from $0.54 to challenge the opposition of the 20-day EMA. The support of technical indicators and the trading volume increases the likelihood of a breakout rally surpassing the daily EMAs. Should you consider going bullish in hopes of a breakout rally?
Key points:
- The DMI indicator prepares a crossover reflecting a bullish trend reversal.
- The CRV price will need to surpass the 20-day EMA to continue the bullish growth.
- The intraday trading volume in the CRV token is $408 Million, indicating a 10% gain.

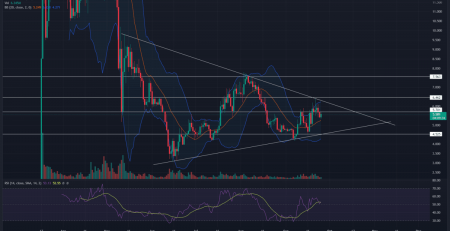
Source-Tradingview
Amid the falling global markets, the altcoin prices continue to plunge with excessive selling pressure. Curve Dao (CRV) prices display a similar trend under the influence of the 20-day EMA providing dynamic resistance.
The bearish trend accounts for an 80% drop in CRV market price from $2.6 to the bottom support at $0.54 within the two months. However, the buyers attempt to reclaim the trend momentum and challenge the 20-day EMA.
The declining price trend generates a bearish resistance trendline in the daily technical chart. The recent bullish attempt from the $0.64 mark goes against the 20-day EMA and the resistance level of $0.85.
Currently going against a confluence of bearish elements, the CRV prices can skyrocket to the next important psychological mark of $1.
The breakout rally will also test the 50-day EMA at the psychological mark, the breakout of which will increase the likelihood of a prolonged uptrend to $1.40. But, more importantly, the EMA breakout will also account for the resistance trendline breakout, unloading the traped momentum.
Conversely, suppose the CRV buyers fail to undermine the excessive selling pressure from the 20-day EMA, a downfall to $0.54 will be inevitable.
Thus, a bullish breakout from longer resistance could trigger a genuine recovery.
Technical analysis
The dynamic resistance of the 20-day EMA is a highly important bearish element, keeping the bullish growth in check since early 2022. Hence, traders can find the EMA breakout triggering a sharp price jump.
The DI lines showcase a growing bullish influence as the lines display a declining bearish spread in an attempt to reclaim bullish alignment. Hence, the DMI indicator may shortly show a crossover indicating a trend reversal and increasing the breakout chances.
- Resistance levels- $0.85 and $1
- Support levels- $0.64 and $0.54
The presented content may include the personal opinion of the author and is subject to market condition. Do your market research before investing in cryptocurrencies. The author or the publication does not hold any responsibility for your personal financial loss.
Close Story


Leave a Reply