

Avalanche: This area could pose substantial near-term resistance
[ad_1]
Disclaimer: The findings of the following analysis are the sole opinions of the writer and should not be considered investment advice.
Bitcoin [BTC] had a bearish outlook on lower timeframes but this was reversed the previous day after a strong surge from $20.8k to $23k.
On higher timeframes, the picture remained unchanged. BTC would have to climb past the $24.1-$24.5k area to flip the structure to bullish.
Similarly, Avalanche [AVAX] also faced a lot of resistance on the charts. Despite the gains made over the past month, the higher timeframe picture has not yet changed for AVAX. The $28 resistance was crucial. More imminently, the $23 mark was one to watch out for.
AVAX- 1-Day Chart
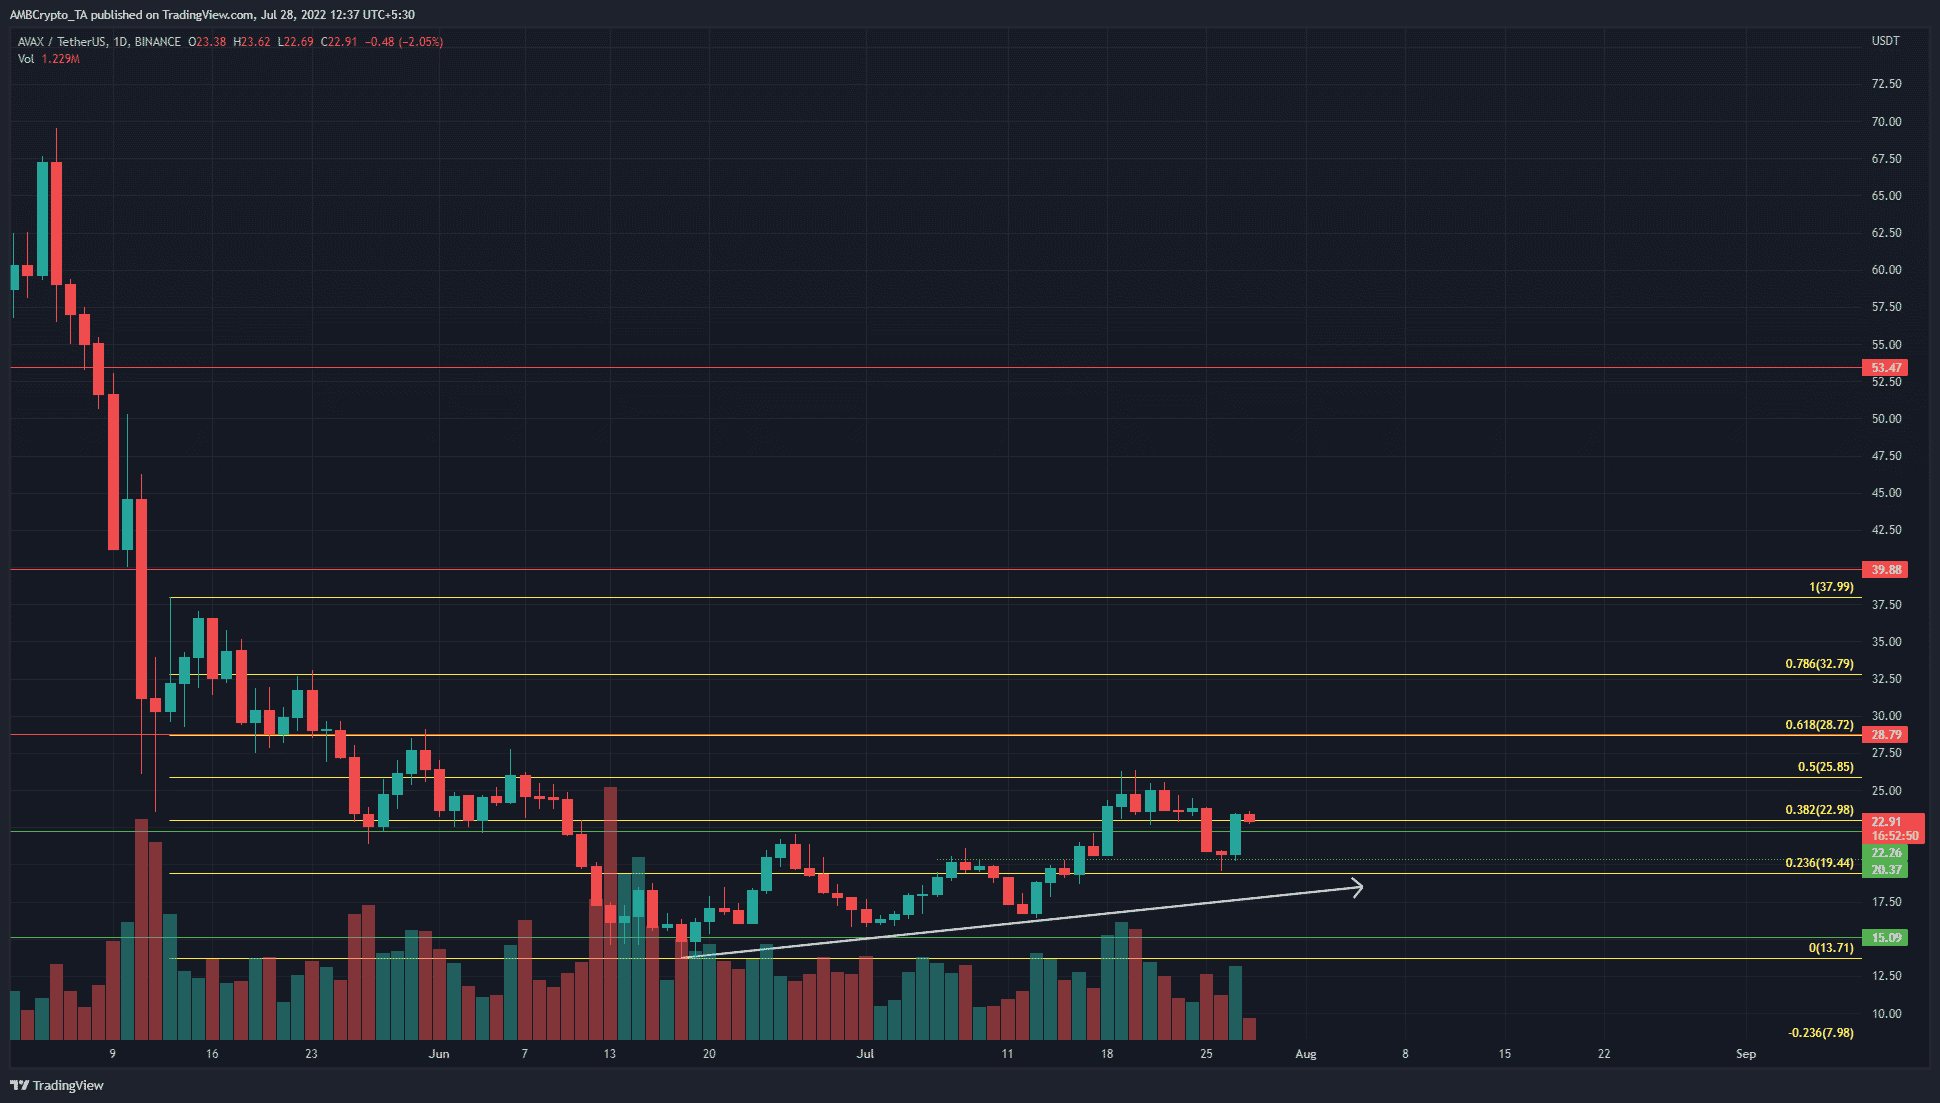
Source: AVAX/USDT on TradingView
On the daily price chart, Avalanche had a slightly hopeful look to it. Since June, the price has formed a series of higher lows. At the same time, the $23 resistance was also broken on two occasions.
A couple of days ago, the price dipped straight back beneath it. However, the formation of the higher lows suggested that buyers were happy to continue to bid AVAX higher and higher.
The Fibonacci retracement levels drawn from the weak bounce in May to June’s low at $13.71 showed the 50% and 61.8% retracement levels to lie at $25.85 and $28.72. The $28.72 level also had confluence with a long-term horizontal level of significance at $28.79.
Therefore, even though AVAX bulls managed to push prices back above $20 and to $23, there was a long way yet to go for the long-term trend to flip bullish.
The $28.7-$32.7 area (61.8%-78.6% retracement) could pose substantial resistance in the weeks to come.
Rationale
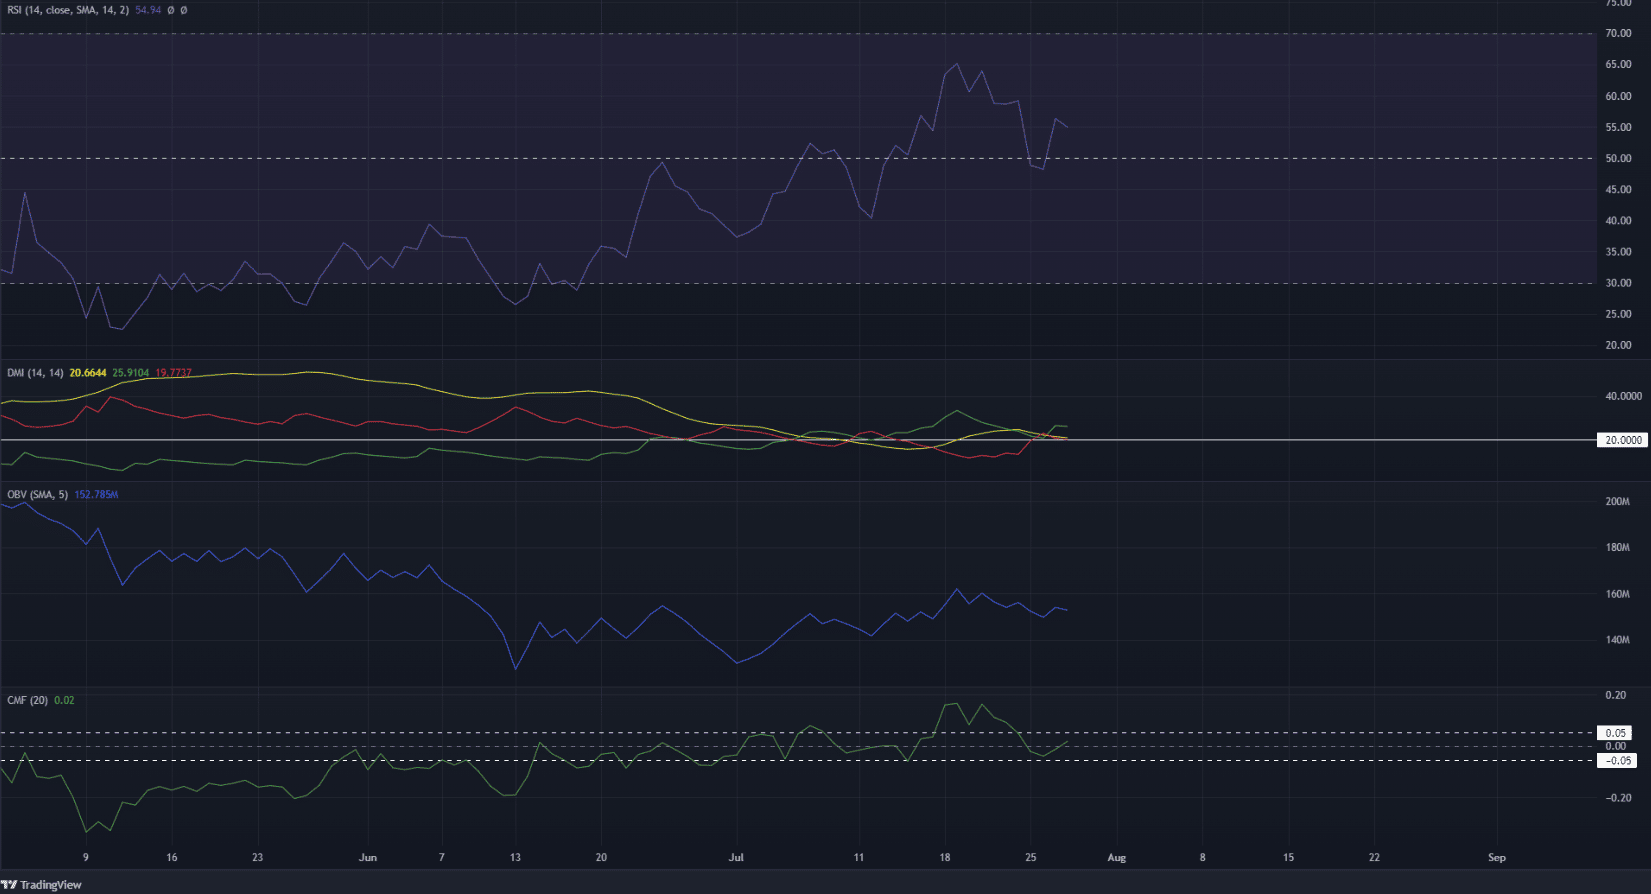
Source: AVAX/USDT on TradingView
The Relative Strength Index (RSI) flipped the neutral 50-mark to support the daily timeframe and did not form a bearish divergence yet.
There could be some choppy waters ahead for AVAX, but overall, the direction over the next week or two looked to be upward.
The Directional Movement Index (DMI) showed a strong trend, just barely. The ADX (yellow) was at 20.6 while the +DI (green) stood at 25.9.
The On-Balance Volume (OBV) was flat since mid-June. The Chaikin Money Flow (CMF) has not spent a significant amount of time above +0.05 either. Both indicators displayed a lack of strong buying pressure.
Conclusion
The momentum indicator RSI showed an uptrend in progress. Yet, the volume indicators showed that no substantial buying volume was witnessed over the past two months.
The price action hinted at a push toward $28. To really flip long-term investors bullish, Avalanche would have to break above the $28 mark and flip the region to demand in the coming weeks.
[ad_2]
Source link


Leave a Reply