

$0.5 Breakout May Extend ADA Recovery by 21%
[ad_1]
Published 1 hour ago
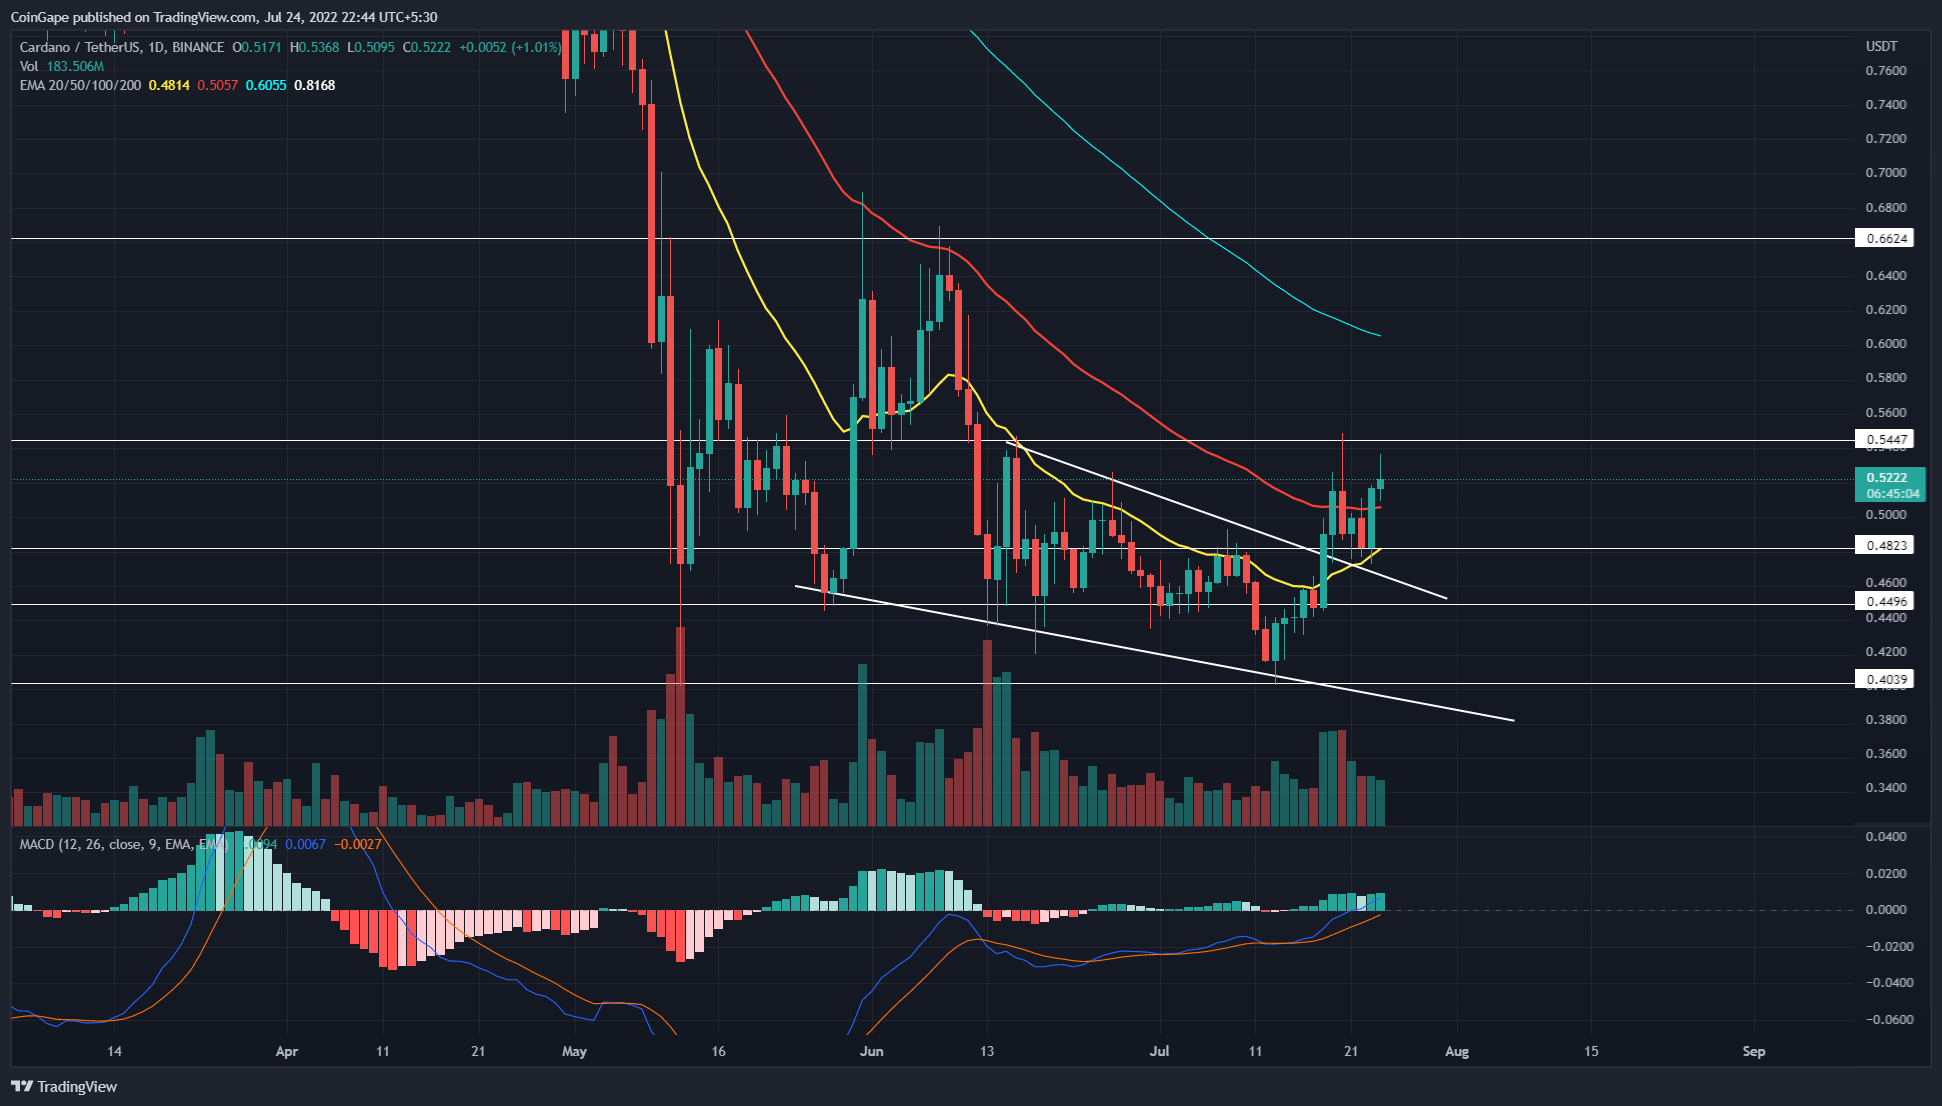
On July 18th, the Cardano (ADA) price gave a decisive breakout from the falling parallel channel pattern, with a significant boost in volume activity. Earlier today, the post-retest rally showcased a 12% growth, which allowed it to rechallenge the $0.5 resistance. However, the sellers defending this level restrict buyers from reclaiming this level.
Key points:
- The ADA price faces supply pressure at a $0.5 resistance
- MACD indicator’s slopes on the verge of entering bullish theory bolster $0.5 breakout
- The intraday trading volume in the ADA coin is $1.07 Billion, indicating a 62.6% gain.
 Source- Tradingview
In response to recent uncertainty in the crypto market, the ADA/USDT pair resonated in a falling parallel channel for more than a month. Furthermore, Under the pattern’s influence, the altcoin retested the May low of $0.4 and validated it as legitimate support.
Since last week, the market sentiment has seen improvement, which triggered a new recovery rally in ADA. On July 13th, the coin price rebounded from the $0.4 support and surged 32% high to the $0.5 mark.
Furthermore, the recovery rally in-between gave a bullish breakout from the falling channel, indicating the buyers are aiming to climb higher. However, the post-retest rally stalled at $0.5 resistance, and higher price rejection attached to the daily candle, indicates the supply pressure remains intact.
Thus, the possible reversal could plunge the coin price to $0.482 and continue the lateral walk for a few more sessions.
On a contrary note, if the buyers undermine the selling pressure and manage a daily candle closing above $0.5, the replenished bullish momentum may push the ADA price 21.5% higher to $0.66.
Technical Indicator
MACD indicator: the fast and slow lines tag the neckline of the neutral zone, offering a potential buy signal among crossover. Moreover, the rising green bars in the histogram chart show a sustained bullish momentum.
EMAs: since early April, the 20-and-50-day EMA has acted as dynamic resistance to ADA price. However, the recent recovery has flipped these resistances into viable support, assisting buyers in extending this rally.
- Resistance levels- $0.54, and $0.66
- Support levels- $0.482 and $0.45
The presented content may include the personal opinion of the author and is subject to market condition. Do your market research before investing in cryptocurrencies. The author or the publication does not hold any responsibility for your personal financial loss.
Close Story
[ad_2]
Source link


Leave a Reply